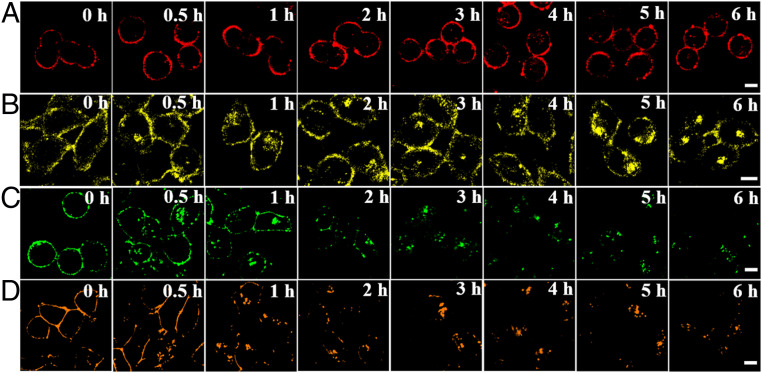
Fig. 4.
The long-term in situ images of HYPQG, HTPQA, Memb-Tracker Green, and Memb-Tracker Red in live cells. Cells were incubated with HYPQG (A), HTPQA (B), Memb-Tracker Green (C), and Memb-Tracker Red (D) for different times; then fluorescence imaging was carried out. All “0 h” fluorescence images were times when the fluorescence signal reached a plateau for each probe, thus ensuring that the long-term imaging experiments were performed under the same conditions. (Scale bar, 20 μm.)

