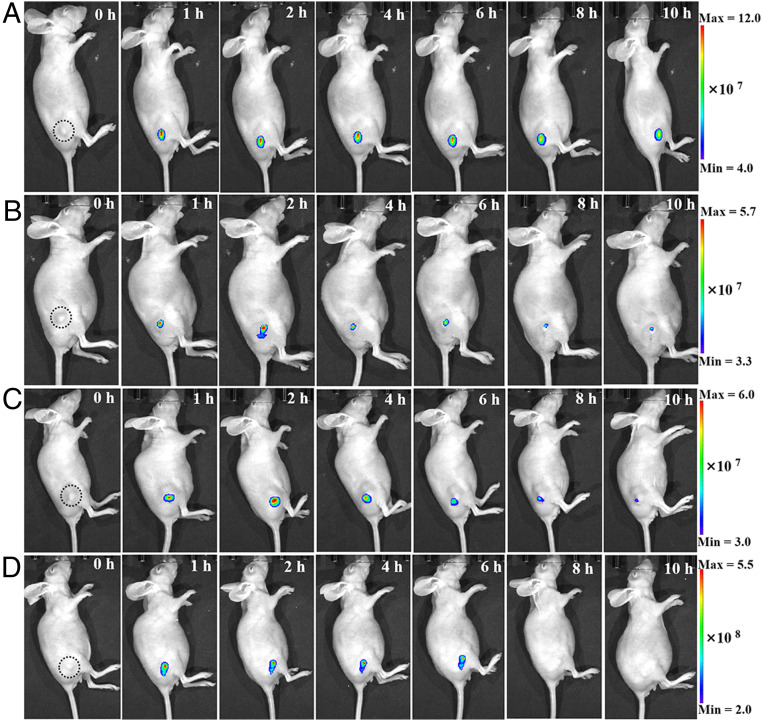
Fig. 6.
Long-term in situ imaging of GGT in mouse tumors. In vivo real-time imaging of GGT in A2780-bearing nude mice after tumor injection of 20 μM HYPQG (A), DCMG (B), Bcy-GGT (C), and Folate-PEG5000-CY 5.5 (D), respectively. The quantitative analysis was displayed in SI Appendix, Fig. S36A.

