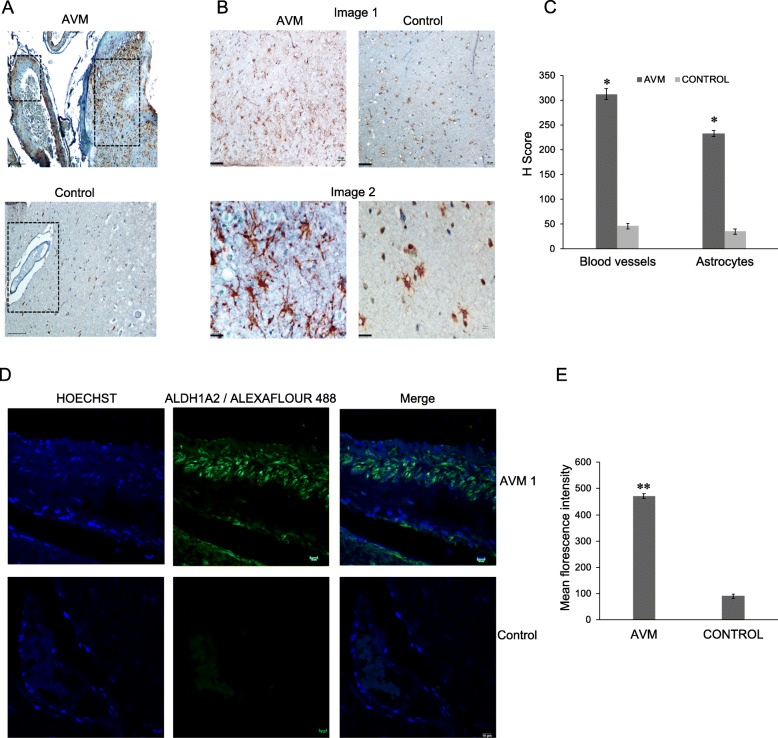
Fig. 3.
Immunostaining of ALDH1A2 in cerebral AVM nidus and control tissues. a Representative image of immunohistochemical analysis with ALDH1A2 antibody in cerebral AVM and control tissues shows increased expression of ALDH1A2 in AVM blood vessels. In control tissues, there is no expression of ALDH1A2 in the blood vessel. The images were collected with × 20 magnification (scale bar, 100 μm). b The immunohistochemical analysis of cerebral AVM and its associated astrocytes shows increased expression of ALDHA2 protein compared to astrocytes in the control tissue. Image 1 shows × 10 magnification and image 2 shows × 40 magnification (scale bar 100 μm). c The bar plot represents the H score analysis of ALDH1A2 protein expression. There is increased expression of this protein in AVM tissue compared to control (*P < 0.05), AVM (n = 10) and control (n = 10). d Immunofluorescence analysis of cerebral AVM and control tissues with ALDH1A2 shows upregulation in AVM blood vessel (green). In control vessels, there is less expression of ALDH1A2 protein. The Hoechst 33342 (blue) dye is used to counter stain nuclei of the cells. The images were collected using × 60 magnification (scale bar, 10 μm). e The bar plot represents the mean fluorescence intensity of ALDH1A2 in AVM and control blood vessel. There is an increased expression of ALDH1A2 in AVM blood vessel compared to control (*P < 0.05), AVM (n = 10) and control (n = 10)

