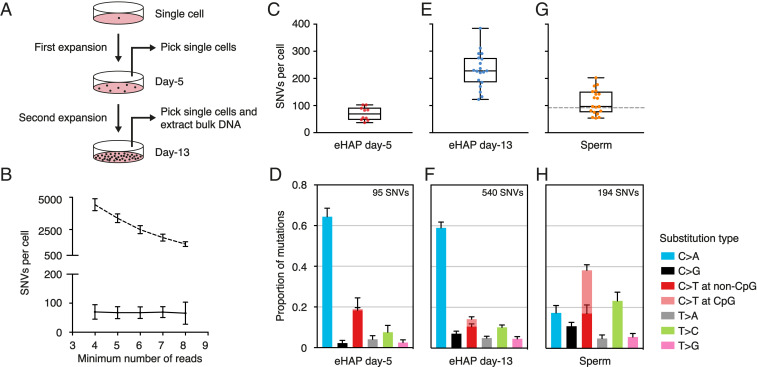
Fig. 2.
Validation of META-CS in clonally expanded single cells and human sperm. (A) Experimental design for clonal expansion of an eHAP single cell. (B) Number of SNVs per cell with regard to the changing of calling threshold. The horizontal axis represents the minimum number of reads required to call a mutation. For callings with the strand filter (solid line), thresholds are set as a4s2, a5s2, a6s3, a7s3, and a8s4. For calling without the strand filter (dashed line), thresholds are set as a4s0, a5s0, a6s0, a7s0, and a8s0. Error bars represent SD. (C, E, and G) Box and whisker plot of the number of SNVs determined in day-5 eHAP (C), day-13 eHAP (E), and human sperm single cells (G). Each dot represents a single cell. The dashed line in G indicates the number of germline mutations at age 56 by fitting a linear regression model to data obtained from family trios (16). (D, F, and H) Relative contribution of mutation types for day-5 eHAP (D), day-13 eHAP (F), and sperm (H). Data are represented as the mean contribution of each mutation type from all single cells. Error bars represent SE. The total number of mutations is indicated (Top).

