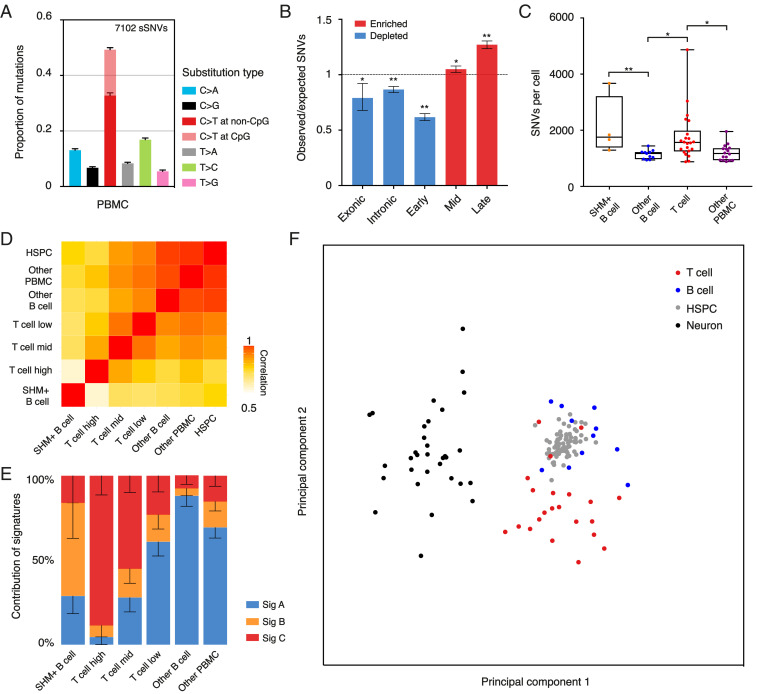
Fig. 4.
Mutational frequency and spectrum of SNVs vary across different types of cells. (A) Relative contribution of mutation types for PBMCs. Data are represented as the mean contribution of each mutation type from all single cells (53 PBMCs). Error bars represent SE. The total number of SNVs is indicated (Top). (B) Enrichment and depletion of SNVs detected in PBMCs in exons, introns, and replication timing domains (early, mid, and late). The expected values are calculated by assuming that SNVs distribute randomly along the genome. Errors bars denote 95% CI. *P < 0.005, **P < 0.0001, two-tailed binomial test. (C) Box and whisker plot of the number of SNVs identified in PBMCs. Each dot represents a single cell. *P < 0.05, **P < 0.01, two-tailed t test. (D) Correlation matrix of the mutational spectrum in a trinucleotide context for PBMCs and HSPCs. Data of HSPCs were obtained from ref. 25. (E) Proportion of the total number of detected SNVs in PBMCs as contributed by each mutational signature. Error bars represent SE. (F) Principal-component analysis of the mutational spectrum in a trinucleotide context for a T cell, B cell (SHM+ B cells were excluded), HSPC, and neuron. Each dot represents a single cell.

