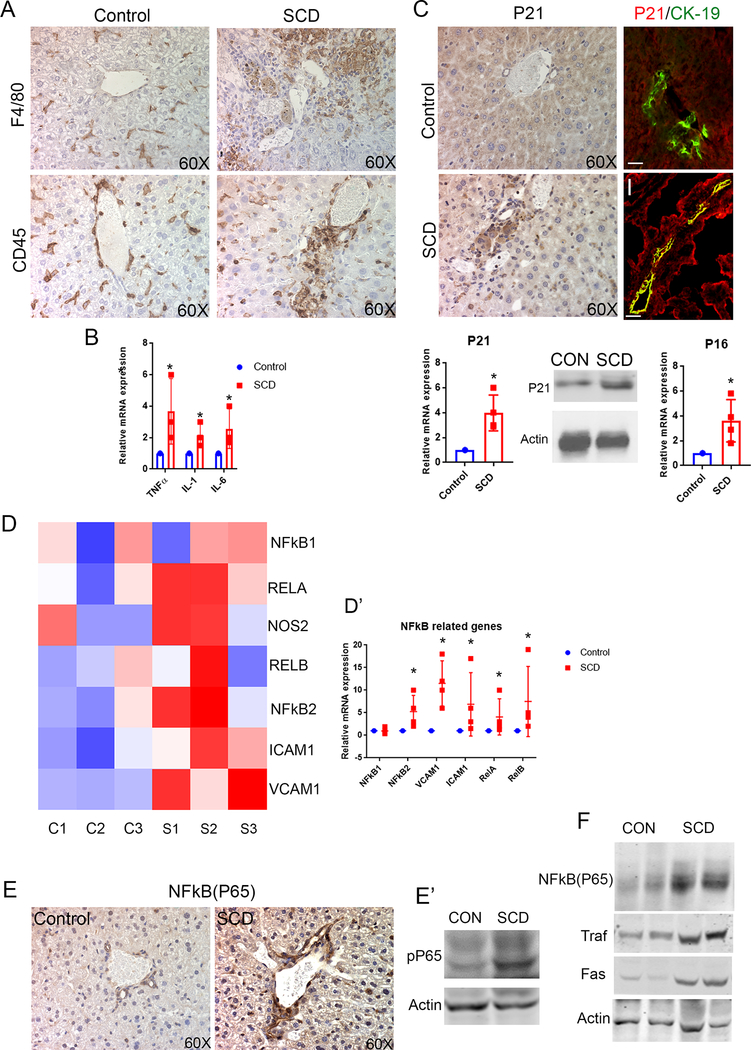
Figure 5: SCD is associated with increased cholangiocyte senescense and NF-kB activation in the liver.
(A) F4/80 and CD45 staining and quantification showed increased inflammation in SCD mouse liver. (B) qRT-PCR analysis of control and SCD mice liver exhibit an increase in mRNA expression of TNFα, IL-1, and IL-6. (C) IHC for P21 showed an increase in cholangiocyte positive P21 in SCD mouse liver. IF of P21/CK-19 exhibits almost complete colocalization of P21 (red) CK-19 (green) in SCD mouse liver. qRT-PCR analysis showed an increase in mRNA level of P21 in SCD mouse liver. Wetern blot showed increase in P21 expression in SCD liver. qRT-PCR analysis showed increase in mRNA level of P16 in the liver of SCD mice. (D) Heat maps consisting of selected genes involved in NF-kB pathway. (D’) Analysis of mRNA expression by qRT-PCR showed increase in mRNA expression of NFκB pathway components in SCD mice liver. (E) IHC for NFκB (P65) showed significantly increased expression in SCD cholangiocytes compared to control. Western Blot for phosphor-P65 confirms significant upregulation in the liver of SCD mice. (F) Western Blot for NF-kB(P65), Traf-1 and FAS exhibits increased expression in the liver of SCD mice. * denotes p>0.05.

