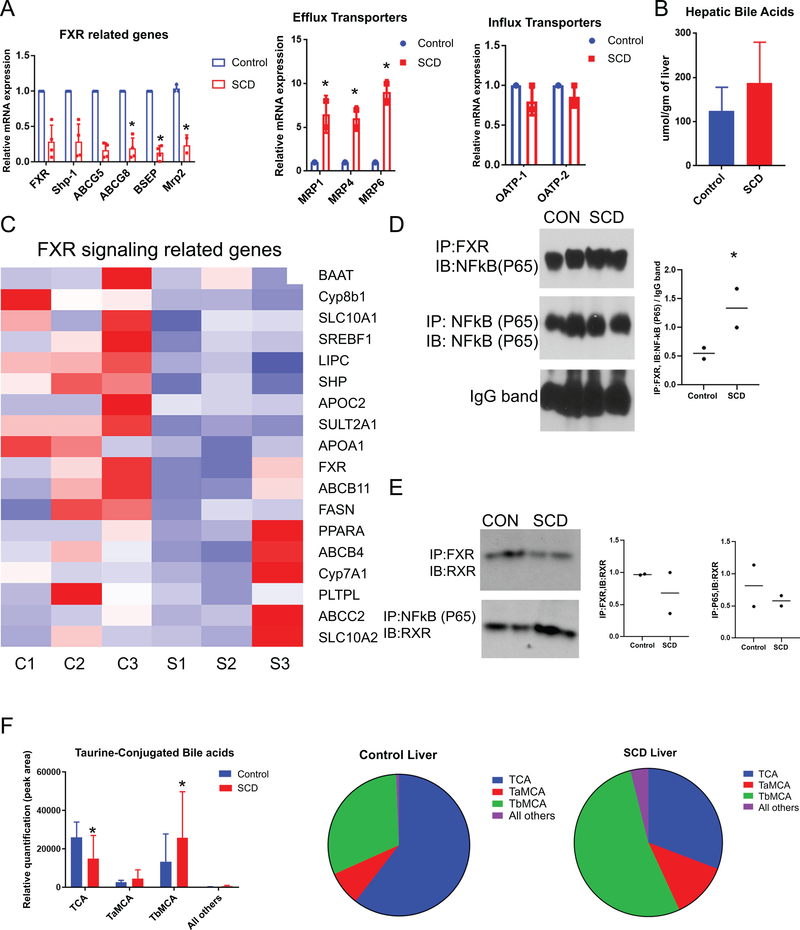
Figure 6: SCD mice exhibit impaired FXR signalling.
(A) qRT-PCR analysis reveals the expression level of FXR, Shp, BSEP, ABCG5, ABCG-8, and MRP2 in SCD and control mice liver. qRT-PCR analysis reveals the expression level of efflux and influx transporters in SCD and control mice liver. (B) Hepatic total bile acid is increased in SCD mice. (C) Heat maps consisting of selected genes involved in FXR pathway. (D) IP with FXR shows association with NF-kB in WT livers which was increased in SCD liver. Quantification of FXR and NF-kB(p65) binding. (E) IP shows FXR/RXR association is reduced in SCD as compared to control. Association between NF-kB and RXR increased in SCD liver, as compared to control. Quantification of FXR and RXR binding. Quantification of RXR and NF-kB(P65) binding.(F) Analysis of bile acid species showed increase in TCA, TαMCA, and TβMCA in the livers of SCD mice, which resulted in a lower percentage of TCA in these livers when expressed qualitatively as a percentage of total bile acids (pie chart). * denotes p>0.05.

