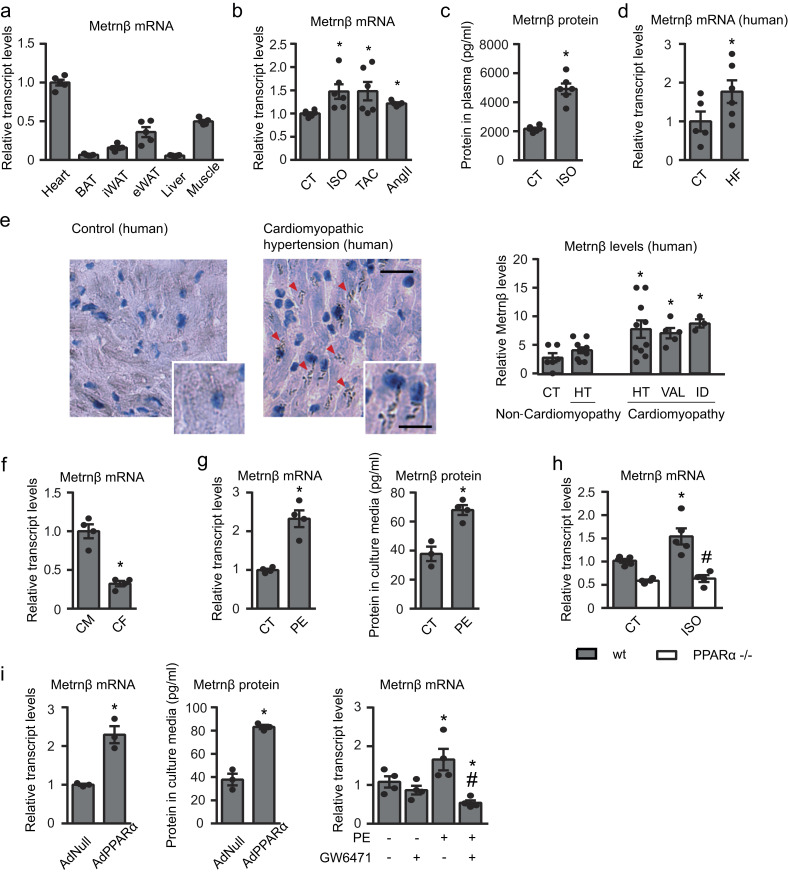
Figure 1.
Metrnβ is expressed and released by cardiac cells, up-regulated in response to hypertrophic stimuli, and controlled by the PPARα pathway. (a) Metrnβ expression levels in heart, brown adipose tissue (BAT), inguinal white adipose tissue (iWAT) and epididymal white adipose tissue (eWAT), liver, and skeletal muscle of adult mice (n = 5 mice/group). (b) Metrnβ mRNA levels in mouse heart after induction of cardiac hypertrophy by 7 d of ISO infusion, 1 mo of TAC, or 7 d of AngII (n = 6 mice/group; Student’s t test; P values are 0.0143, 0.0374, 0.0003). (c) Circulating Metrnβ protein levels (n = 6 mice/group; Student’s t test; P < 0.0001). (d) Cardiac Metrnβ expression levels in control individuals (CT; n = 5) and HF patients (n = 6); Mann-Whitney test; P = 0.0317. (e) Metrnβ immunohistochemistry in human hearts and quantification of the Metrnβ expression index as the ratio of positively stained to negatively stained myocytes. CT (n = 6), hypertension (HT; n = 11 non-cardiomyopathy [non-CMP] and n = 10 CMP), valvular (VAL; n = 5), idiopathic (ID; n = 3). Mann-Whitney test; P = 0.0402, 0.0152, 0.0238. Magnification, 20×. Scale bars, 25 µm (inset) and 50 µm. Red arrowheads show positive staining. (f) Metrnβ mRNA levels in the CM and CF fractions from isolated rat hearts. Data are representative of four independent experiments; Student’s t test; P = 0.0004. (g) Metrnβ mRNA levels in NCMs and protein levels in culture media after PE stimulation for 24 h. Data are representative of four independent experiments; Student’s t test; P values are 0.0009, 0.0034. (h) Metrnβ mRNA levels in WT littermates and PPARα−/− mice injected with ISO (i.p.) for 7 d (n = 5 mice/group; one-way ANOVA; P values are 0.0182, 0.0031). (i) Metrnβ mRNA and protein levels in NCMs overexpressing PPARα (AdPPARα) or control vector (AdNull; 10 IFU/cell; data are representative of three independent experiments; Student’s t test; P values are 0.0043, 0.001), and Metrnβ mRNA levels in NCMs treated with PE and the PPARα antagonist GW6471 (1 µM), alone or in combination, for 24 h (data are representative of four independent experiments; one-way ANOVA; P values are 0.0494, #0.0077, *0.0448). Results are expressed as mean ± SEM (*, P < 0.05 compared with control human hearts, WT control mice, or control cells; #, P < 0.05 compared with ISO-treated WT animals [h] or PE-stimulated cells [i]).

