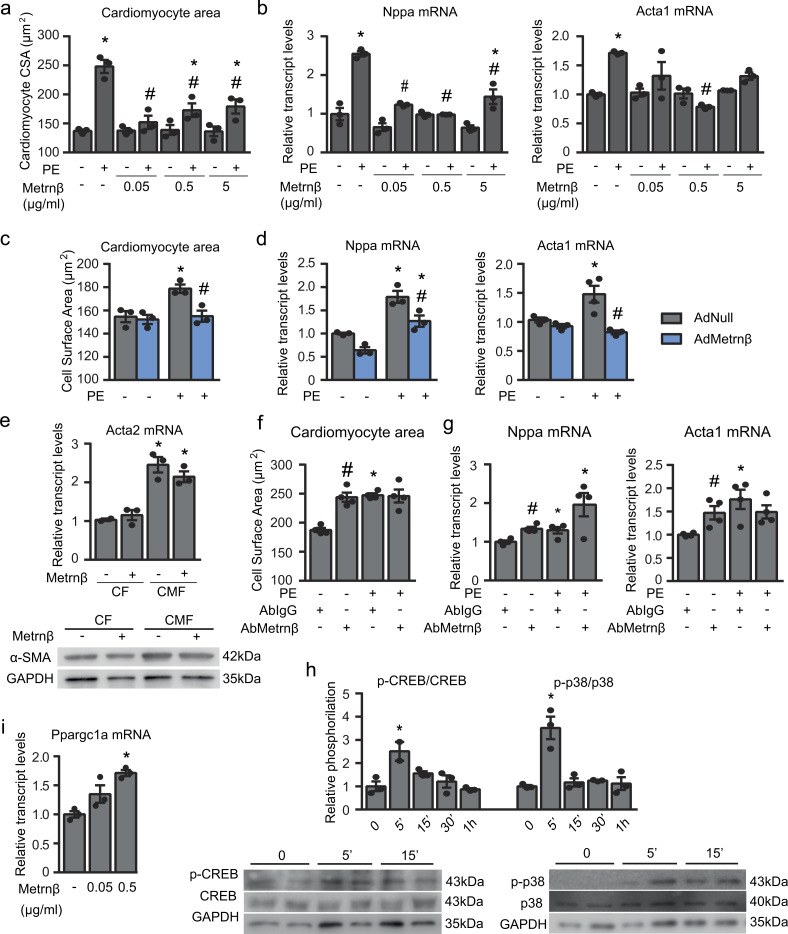
Figure 5.
Effects of Metrnβ on cardiomyocytes: protection against PE-induced hypertrophy in an autocrine manner. (a and b) Cardiomyocyte size (a; CSA; data are representative of three independent experiments; P values are 0.0007, 0.0039, 0.0097, 0.0143, 0.0307, 0.0437) and mRNA expression levels (b) of the hypertrophy markers Nppa and Acta1 in NCMs after PE-induced hypertrophy alone or with Metrnβ pretreatment for 24 h at different concentrations (data are representative of three independent experiments; P values are <0.0001, <0.0001, 0.0051, 0.0153, <0.0001, <0.0001). (c and d) Cardiomyocyte size (c; CSA; data are representative of three independent experiments; P values are 0.016, 0.0169) and mRNA expression levels [d] of the hypertrophy markers Nppa and Acta1 in NCMs overexpressing Metrnβ (Ad-Metrnβ; blue bars) or Ad-null control vector (Ad-null; gray bars) at 10 IFU/cell and treated with PE for 24 h (data are representative of three independent experiments; P values are 0.0037, 0.0108, 0.0421, 0.0327, 0.0082). (e) α-SMA (Acta2) expression levels in Metrnβ (0.5 µg/ml)-treated primary culture CFs at P1 and P3 (data are representative of three independent experiments; P values are 0.002, 0.0065). (f and g) Cardiomyocyte size (f; CSA; data are representative of two independent experiments; P values are both <0.0001) and mRNA expression levels (g) of the hypertrophy markers Nppa and Acta1 in NCMs treated with anti-Metrnβ antibody or control anti-IgG antibody added to the culture medium in the presence or absence of PE (data are representative of two independent experiments; P values are 0.0015, 0.0181, 0.0002, 0.011, 0.0182). (h) Phosphorylation levels determined by Milliplex (left) and Western blot (right) of CREB and p38 in NCMs treated with Metrnβ (0.5 µg/ml) for different durations (data are representative of three independent experiments; P values are 0.0336, 0.0066). (i) Ppargc1a (PGC1α) expression levels in NCMs treated with different concentrations of Metrnβ for 24 h (data are representative of three independent experiments; P = 0.0007). Results are expressed as mean ± SEM. Data were analyzed by Student’s t test (*, P < 0.05 compared with control cells; #, P < 0.05 compared with PE-treated or corresponding controls).

