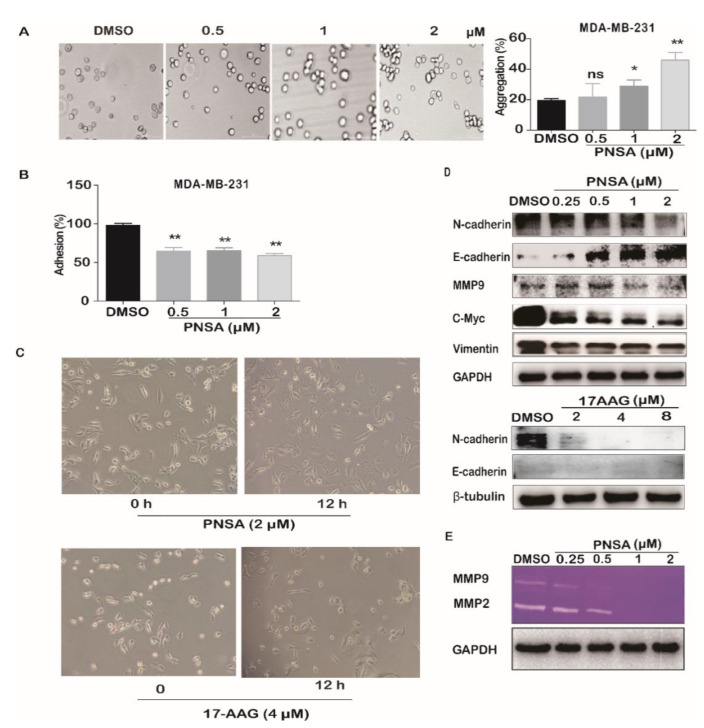
Figure 3.
PNSA reverses epithelial–mesenchymal transformation (EMT) of MDA-MB-231 cells. (A) Effect of PNSA on cell aggregation. MDA-MB-231 cell suspensions were treated with different concentrations of PNSA (0.5, 1, 2 μM), and then cells were photographed (left panel) and counted for statistical analysis (right panel). (B) Effect of PNSA on cell adhesion. MDA-MB-231 cells were treated with different concentrations of PNSA (0.5, 1, 2 μM) for 12 h, the number of adhering cells was analyzed by 3-(4,5-dimethyl-2-thia-zolyl)-2,5-diphenyl-2-H-tetrazolium bromide (MTT) assay. (C) Effect of PNSA on cellular morphology. MDA-MB-231 cells were treated with PNSA (2 μM) (top panel) or 17-AAG (4 μM) (bottom panel) for 12 h and cell morphology was determined by a microscope. (D) Effects of PNSA and 17-AAG on the expressions of proteins related to metastasis. MDA-MB-231 cells were treated with PNSA (0.25, 0.5, 1, 2 μM) and 17-AAG (4 μM) for 12h. Protein levels were detected by Western blotting. (E) Inhibition effects of PNSA on proteolytic activities of MMP-9 and MMP-2. MDA-MB-231 cells were incubated with the indicated concentration of PNSA (0.25, 0.5, 1, 2 μM) for 12 h and proteolytic activities of MMP-9 and MMP-2 were measured by gelatin zymography assay. The bar graph represents the average ± SD of at least three independent experiments. * p < 0.05; ** p < 0.01; ns, not significant (relative to DMSO-treated cells).

