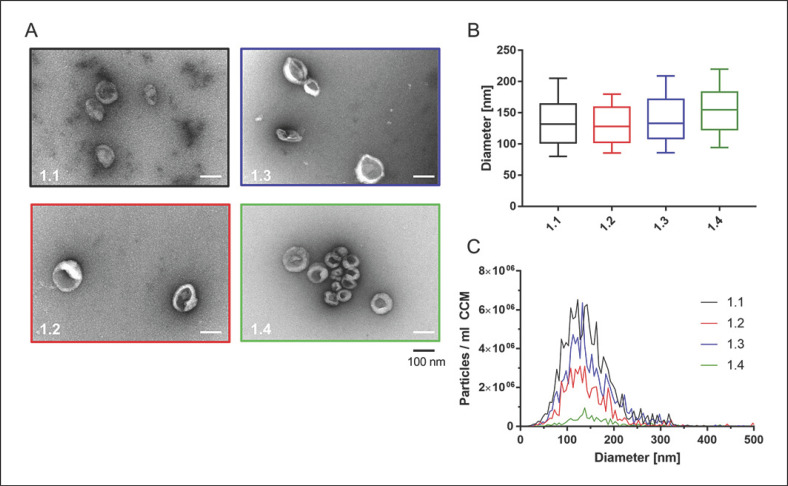
Fig. 2.
Characterization of EVs (first round). A TEM pictures from all EV preparations are depicted. Scale bar, 100 nm. B NTA data of isolated EV sizes. C Full-size profiles are shown for each EV preparation (replicate measurements for each EV isolate). Box: interquartile range; whiskers: 10th and 90th percentile; line: median. Particle concentrations were significantly different with p < 0.01 (1.2 vs. 1.3), p < 0.001 (1.1 vs. 1.3, 1.2 vs. 1.4), and p < 0.0001 (1.1 vs. 1.2, 1.1 vs. 1.4, 1.3 vs. 1.4).

