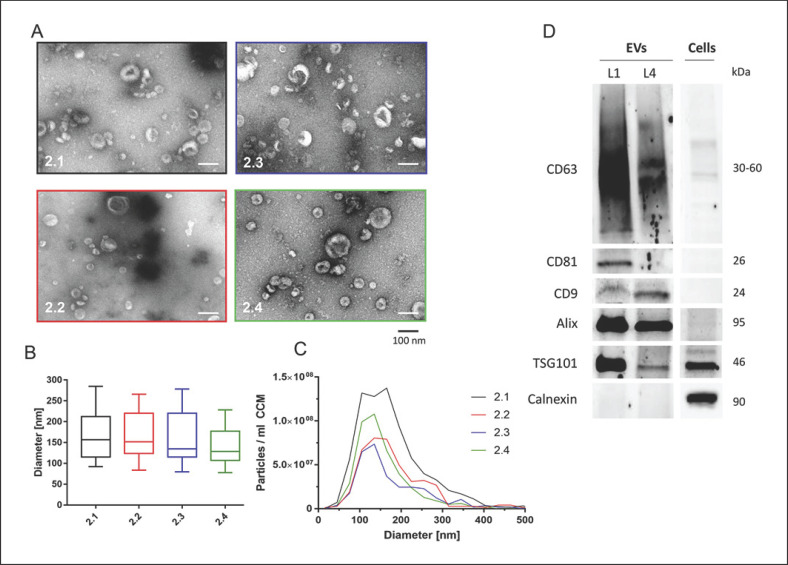
Fig. 3.
Characterization of EVs (second round). A TEM analysis showed spherical and cup-shaped EVs isolated by all laboratories. Scale bar, 100 nm. B NTA of size profiles of isolated EVs. C EV concentrations and size distributions are shown. Particle concentrations were significantly different with p < 0.05 (2.1 vs. 2.2, 2.1 vs. 2.4) and p < 0.01 (2.1 vs. 2.3) or failed to reach statistical significance (2.2 vs. 2.4, 2.3 vs. 2.4). D WB analysis confirmed EV-enriched and EV-depleted protein marker expression in EV and cellular lysates. Protein sizes are indicated.

