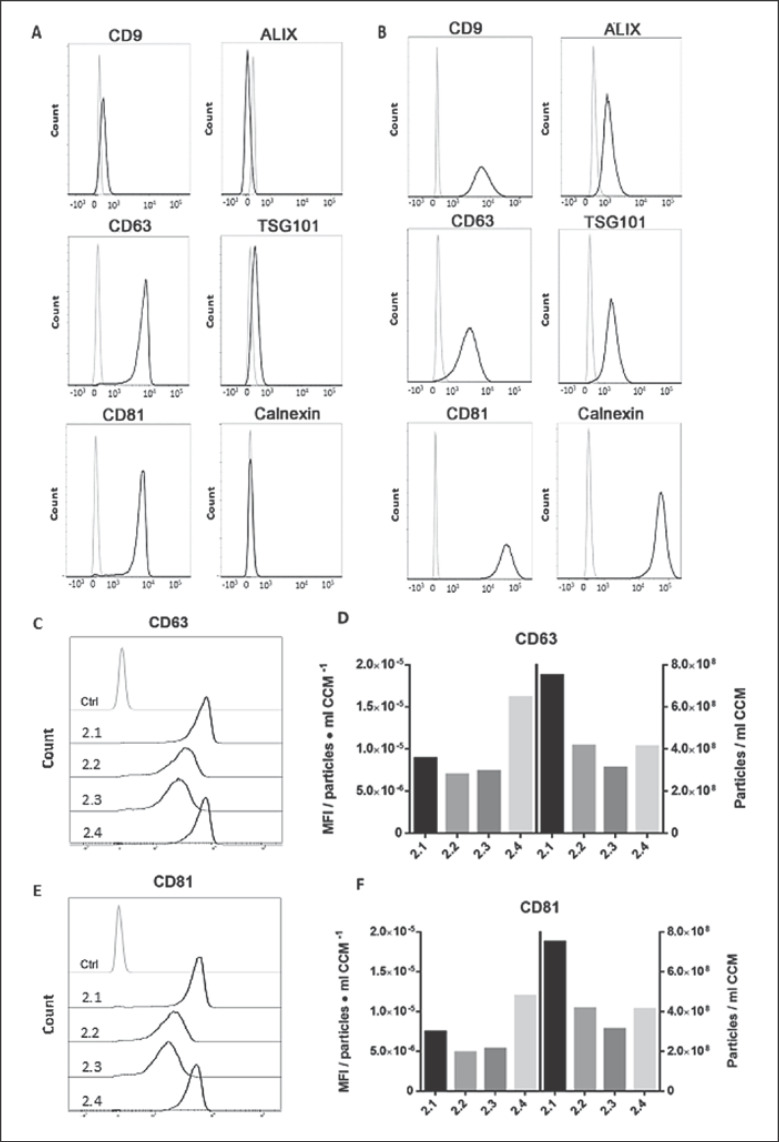
Fig. 4.
FACS-based characterization of isolated EVs (second round). A FACS histograms depicting the relative fluorescence/marker intensity of EV preparation 2.1 (black line) against unstained EV particle control (grey line). B Corresponding marker expression in HCT116 cells (extracellular staining for CD9, CD63, and CD81 and intracellular staining for Alix, TSG101, and calnexin). C, E Mean fluorescence intensity (MFI) raw values of CD63 (C) and CD81 (E) marker expression from laboratories 2.1–2.4. D, F MFI values per particle concentration of CD63 (D) and CD81 (F; left y axis) against the respective particle concentration per ml CCM (right y axis).

