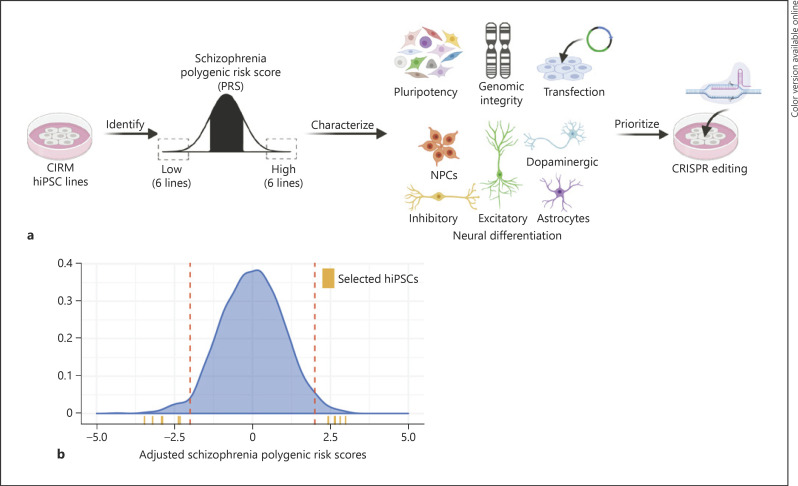
Fig. 1.
Identification, characterization, and prioritization of high and low SZ PRS hiPSC lines. a Schematic summary of analysis pipeline. Figure created with BioRender.com. b Identification of hiPSC lines with >2 SD lower or higher PRS for SZ based on PGC2. The density distribution (blue) depicts the standardized ancestry-adjusted risk scores for ∼1,500 CIRM hiPSC lines (currently available for distribution on the CDI website), the dotted red lines represent >2 SD, and the orange ticks indicate the 6 high and 6 low PRS hiPSC lines of European ancestry selected for this study. SZ, schizophrenia; PRS, polygenic risk scores; hiPSC, human induced pluripotent stem cell; SD, standard deviations; NPCs, neural progenitor cells.

