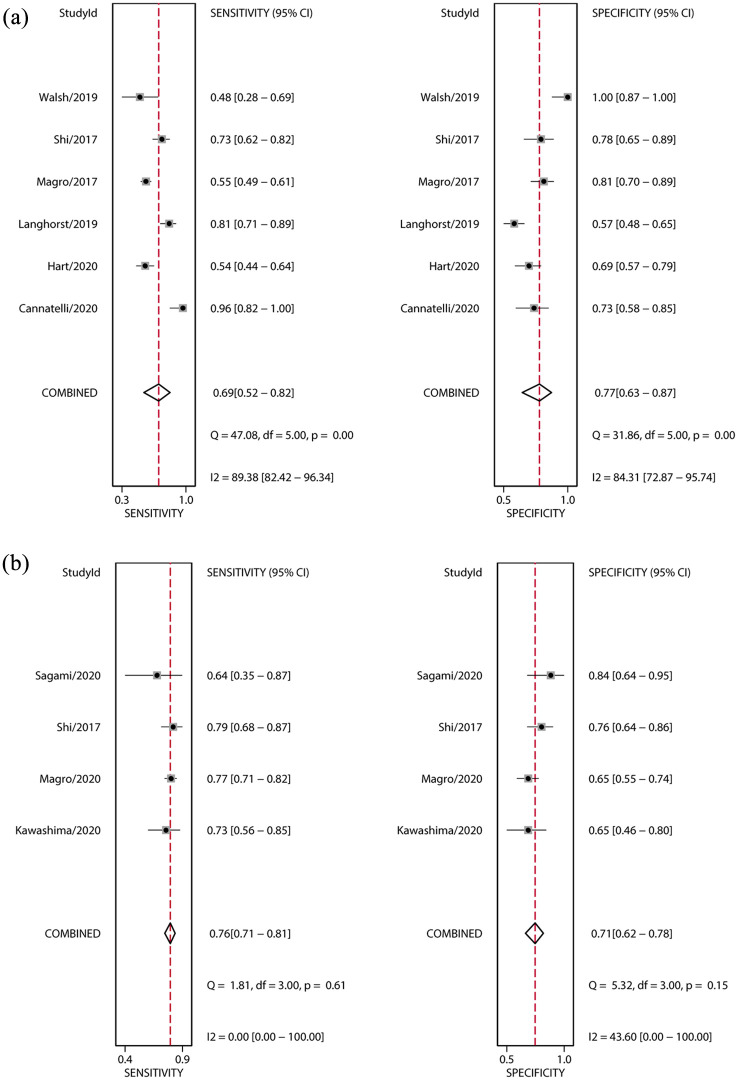
Figure 3.
Forest plots of the sensitivity and specificity of FC for histological activity of UC. (a) Histological response; (b) histological remission. Bivariate mixed-effects models were applied. ■ point estimates; ◊ pooled estimates; error bars indicate 95% CI; data in parentheses are 95% CIs.
CI, confidence interval; FC, fecal calprotectin; UC, ulcerative colitis.

