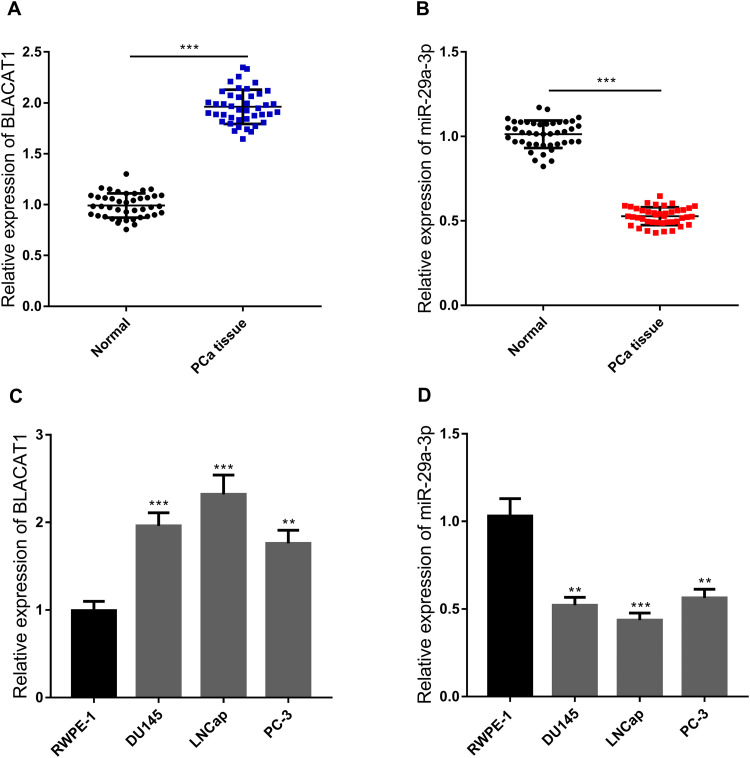
Figure 1.
Expressions of BLACAT1 and miR-29a-3p in PCa. (A-B) qRT-PCR was used to detect the expressions of BLACAT1 and miR-29a-3p in 42 pairs of cancer tissues. n = 42, ** P < 0.01 and *** P < 0.001. (C-D) qRT-PCR was used to detect the expressions of BLACAT1(C) and miR-29a-3p(D) in normal prostate epithelial cell line and PCa cell lines. ** P < 0.01 and *** P < 0.001. All the experiments were replicated 3 times.

