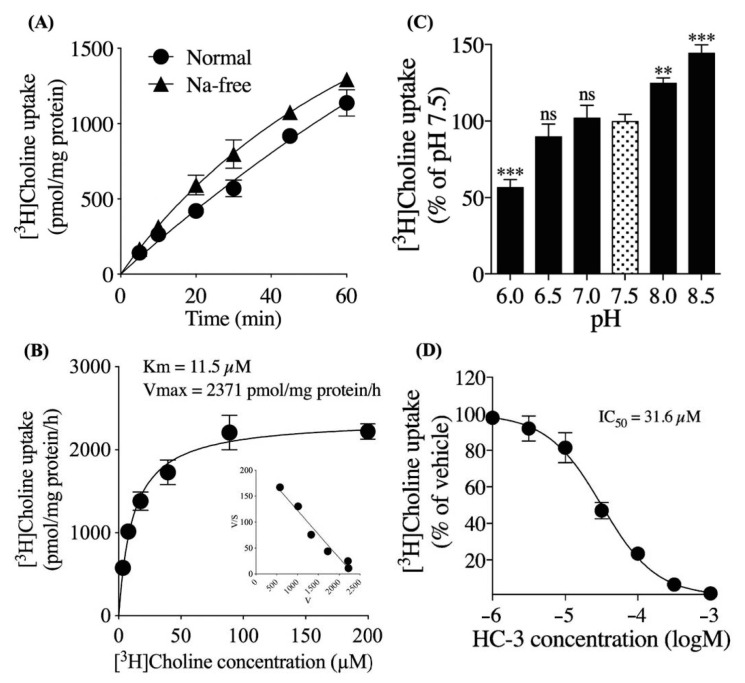
Figure 3.
Extracellular [3H]choline uptake analysis in hNSCs. (A) Time course of 10 μM [3H]choline uptake in the presence and absence of extracellular Na+ over 60 min. (B) The saturation kinetics analysis of [3H]choline uptake. hNSCs were incubated in the uptake buffer with 3.47 to 200 μM [3H]choline for 20 min. Inset: Eadie–Hofstee transformations of the data. (C) In the effect of various degrees of extracellular pH on 10 μM [3H]choline uptake over 20 min. ** p < 0.01 and *** p < 0.001 denote the statistical significance vs. pH 7.5 using Dunnett multiple comparison test. ns means not significant. (D) [3H]choline uptake in various degrees of extracellular hemicholinium-3 (HC-3) concentrations. hNSCs were pre-incubated in each HC-3 concentration for 20 min. The 10 μM [3H]choline uptake was measured for 20 min. The data was fitted to non-linear regression analysis. Each value shows the mean ± SD of four independent experiments.

