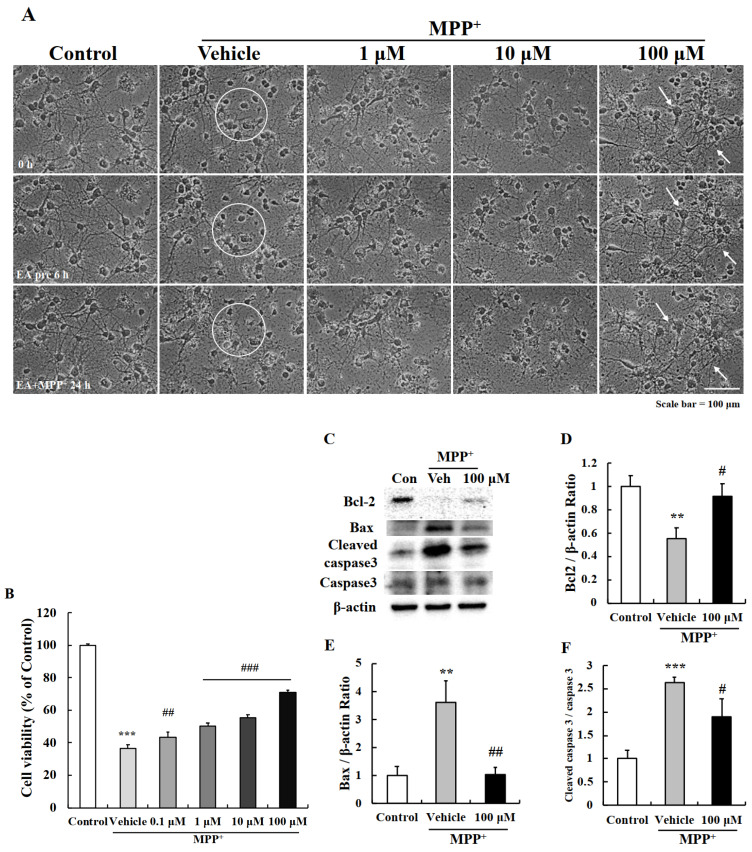
Figure 2.
Anti-apoptotic effect of EA in primary neurons. (A) Representative images showed MPP+-induced neuronal cell death (white circle) and that pretreatment with 100 µM EA had a protective effect. Scale bar = 100 µm. (B) MTT assay confirmed that EA protected cells from MPP+-induced cell death. Values are means ± SEs (n = 8). *** p < 0.001 vs. naïve controls and ### p < 0.001 vs. MPP+-treated controls (the analysis was performed using ANOVA with Fisher’s PLSD procedure). (C) Western blot analysis confirmed that EA downregulated apoptotic markers in MPP+ treated primary neurons. (D–F) Bar graphs of fold changes of western blot. More than three independent experiments were performed and values are means ± SEs (n = 3–5). ** p, *** p < 0.01, 0.001 vs. naïve controls and # p, ## p < 0.05, 0.01 vs. MPP+-treated controls (the analysis was performed using ANOVA with Fisher’s PLSD procedure).

