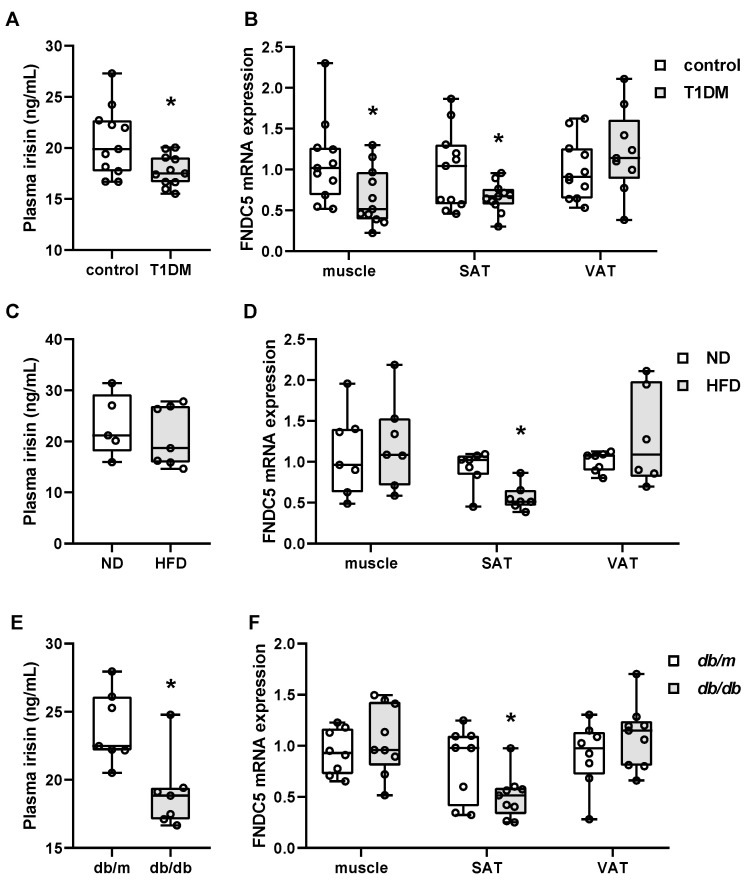
Figure 1.
Circulating irisin and tissue FNDC5 gene expression in type 1 and type 2 diabetic mice. (A,C,E) Plasma irisin was measured in streptozotocin-induced type 1 diabetic (T1DM) mice (n = 11/group), high-fat diet (HFD)-induced obese mice (n = 7/group), and genetically obese db/db mice (n = 8 for db/m, n = 9 for db/db). (B,D,F) Muscle, subcutaneous adipose tissue (SAT) and visceral adipose tissue (VAT) FNDC5 gene expression was measured by real-time PCR. * p < 0.05 compared to the control, normal diet (ND), and db/m, respectively.

