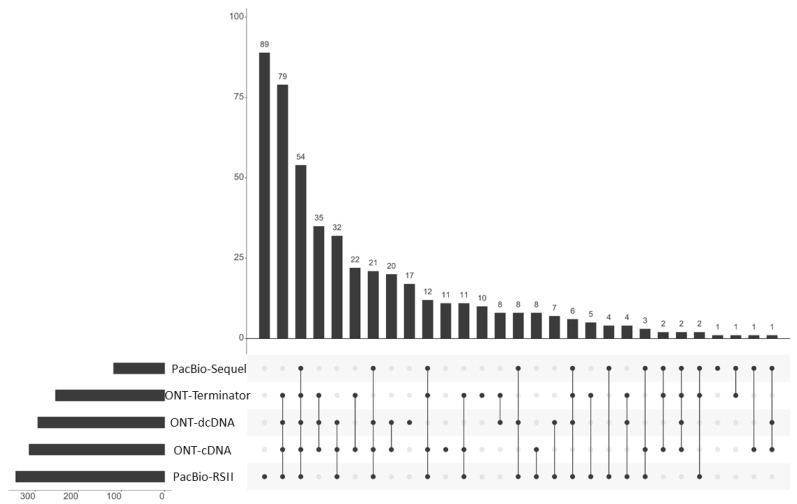
Figure 2.
Transcript characteristics. The UpSet plot indicates the quantitative distribution of the transcripts identified by using various combinations of ONT and PacBio library preparation and sequencing techniques. The horizontal bar graph indicates the counts of annotated transcripts derived from the given sequencing approaches. The vertical bar charts show the number of transcripts (y-axis) detected in the various combination of sequencing approaches (x-axis). The black dots represent the presence of transcripts within the given experiments. Every possible intersection (lines with dots) is represented.

