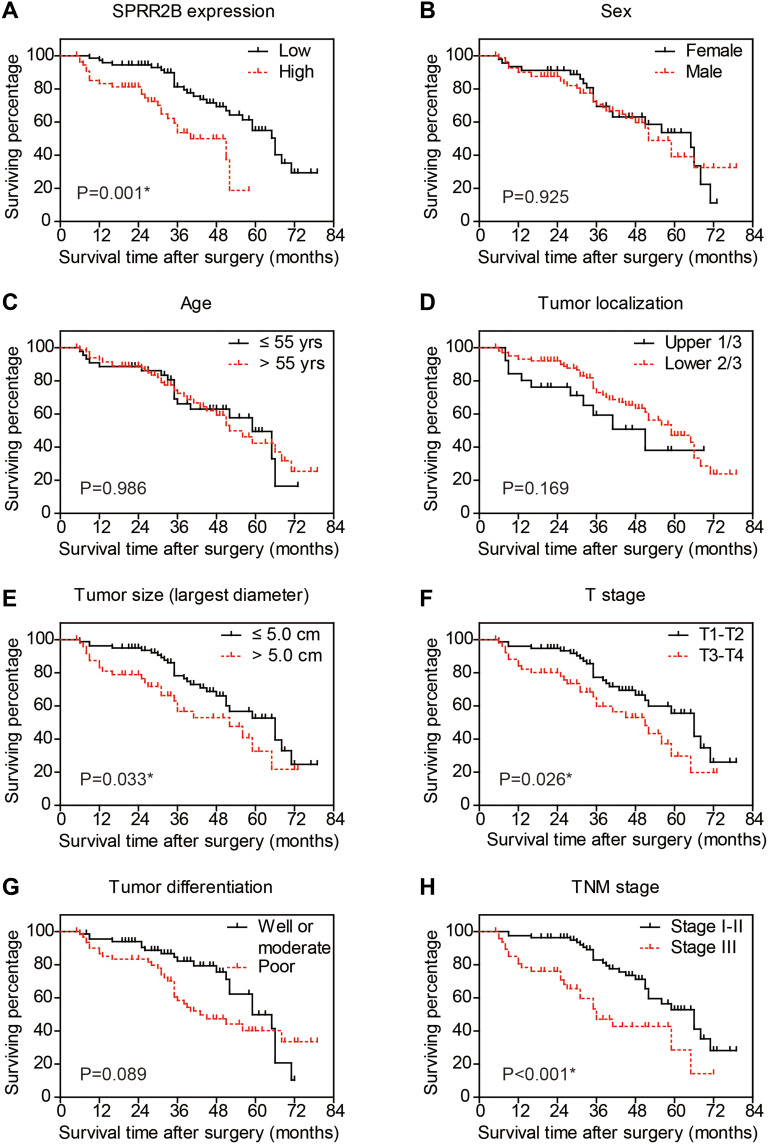
Figure 2.
Overall survival of gastric adenocarcinoma patients by Kaplan-Meier test. The overall survival curves were plotted according to different clinicopathological characteristics, including SPRR2B expression level (A), sex (B), age (C), tumor localization (D), tumor size (E), T stage (F), tumor differentiation (G), and TNM stage (H). *Indicates P<0.05 by Log rank test.

