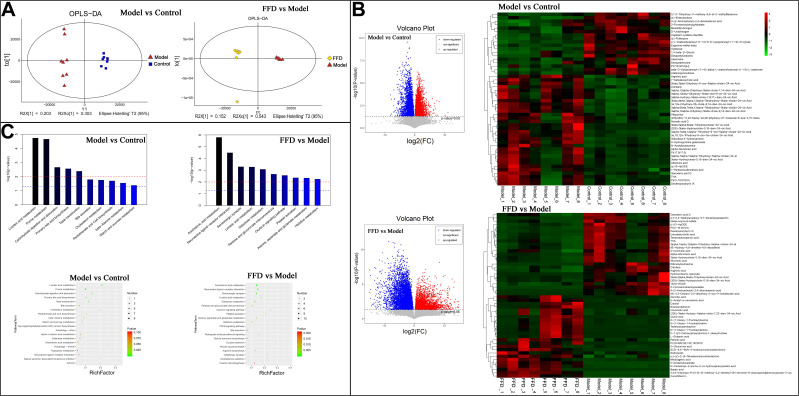
Figure 5.
The results of the fecal metabolite analysis. (A) Quality control results. (B) A heatmap of different metabolites and the 50 most abundant differentially-detected metabolites between the FFD and model groups. (C) The metabolic pathway enrichment results obtained through the Kyoto Encyclopedia of Genes and Genomes (KEGG) ID analysis.

