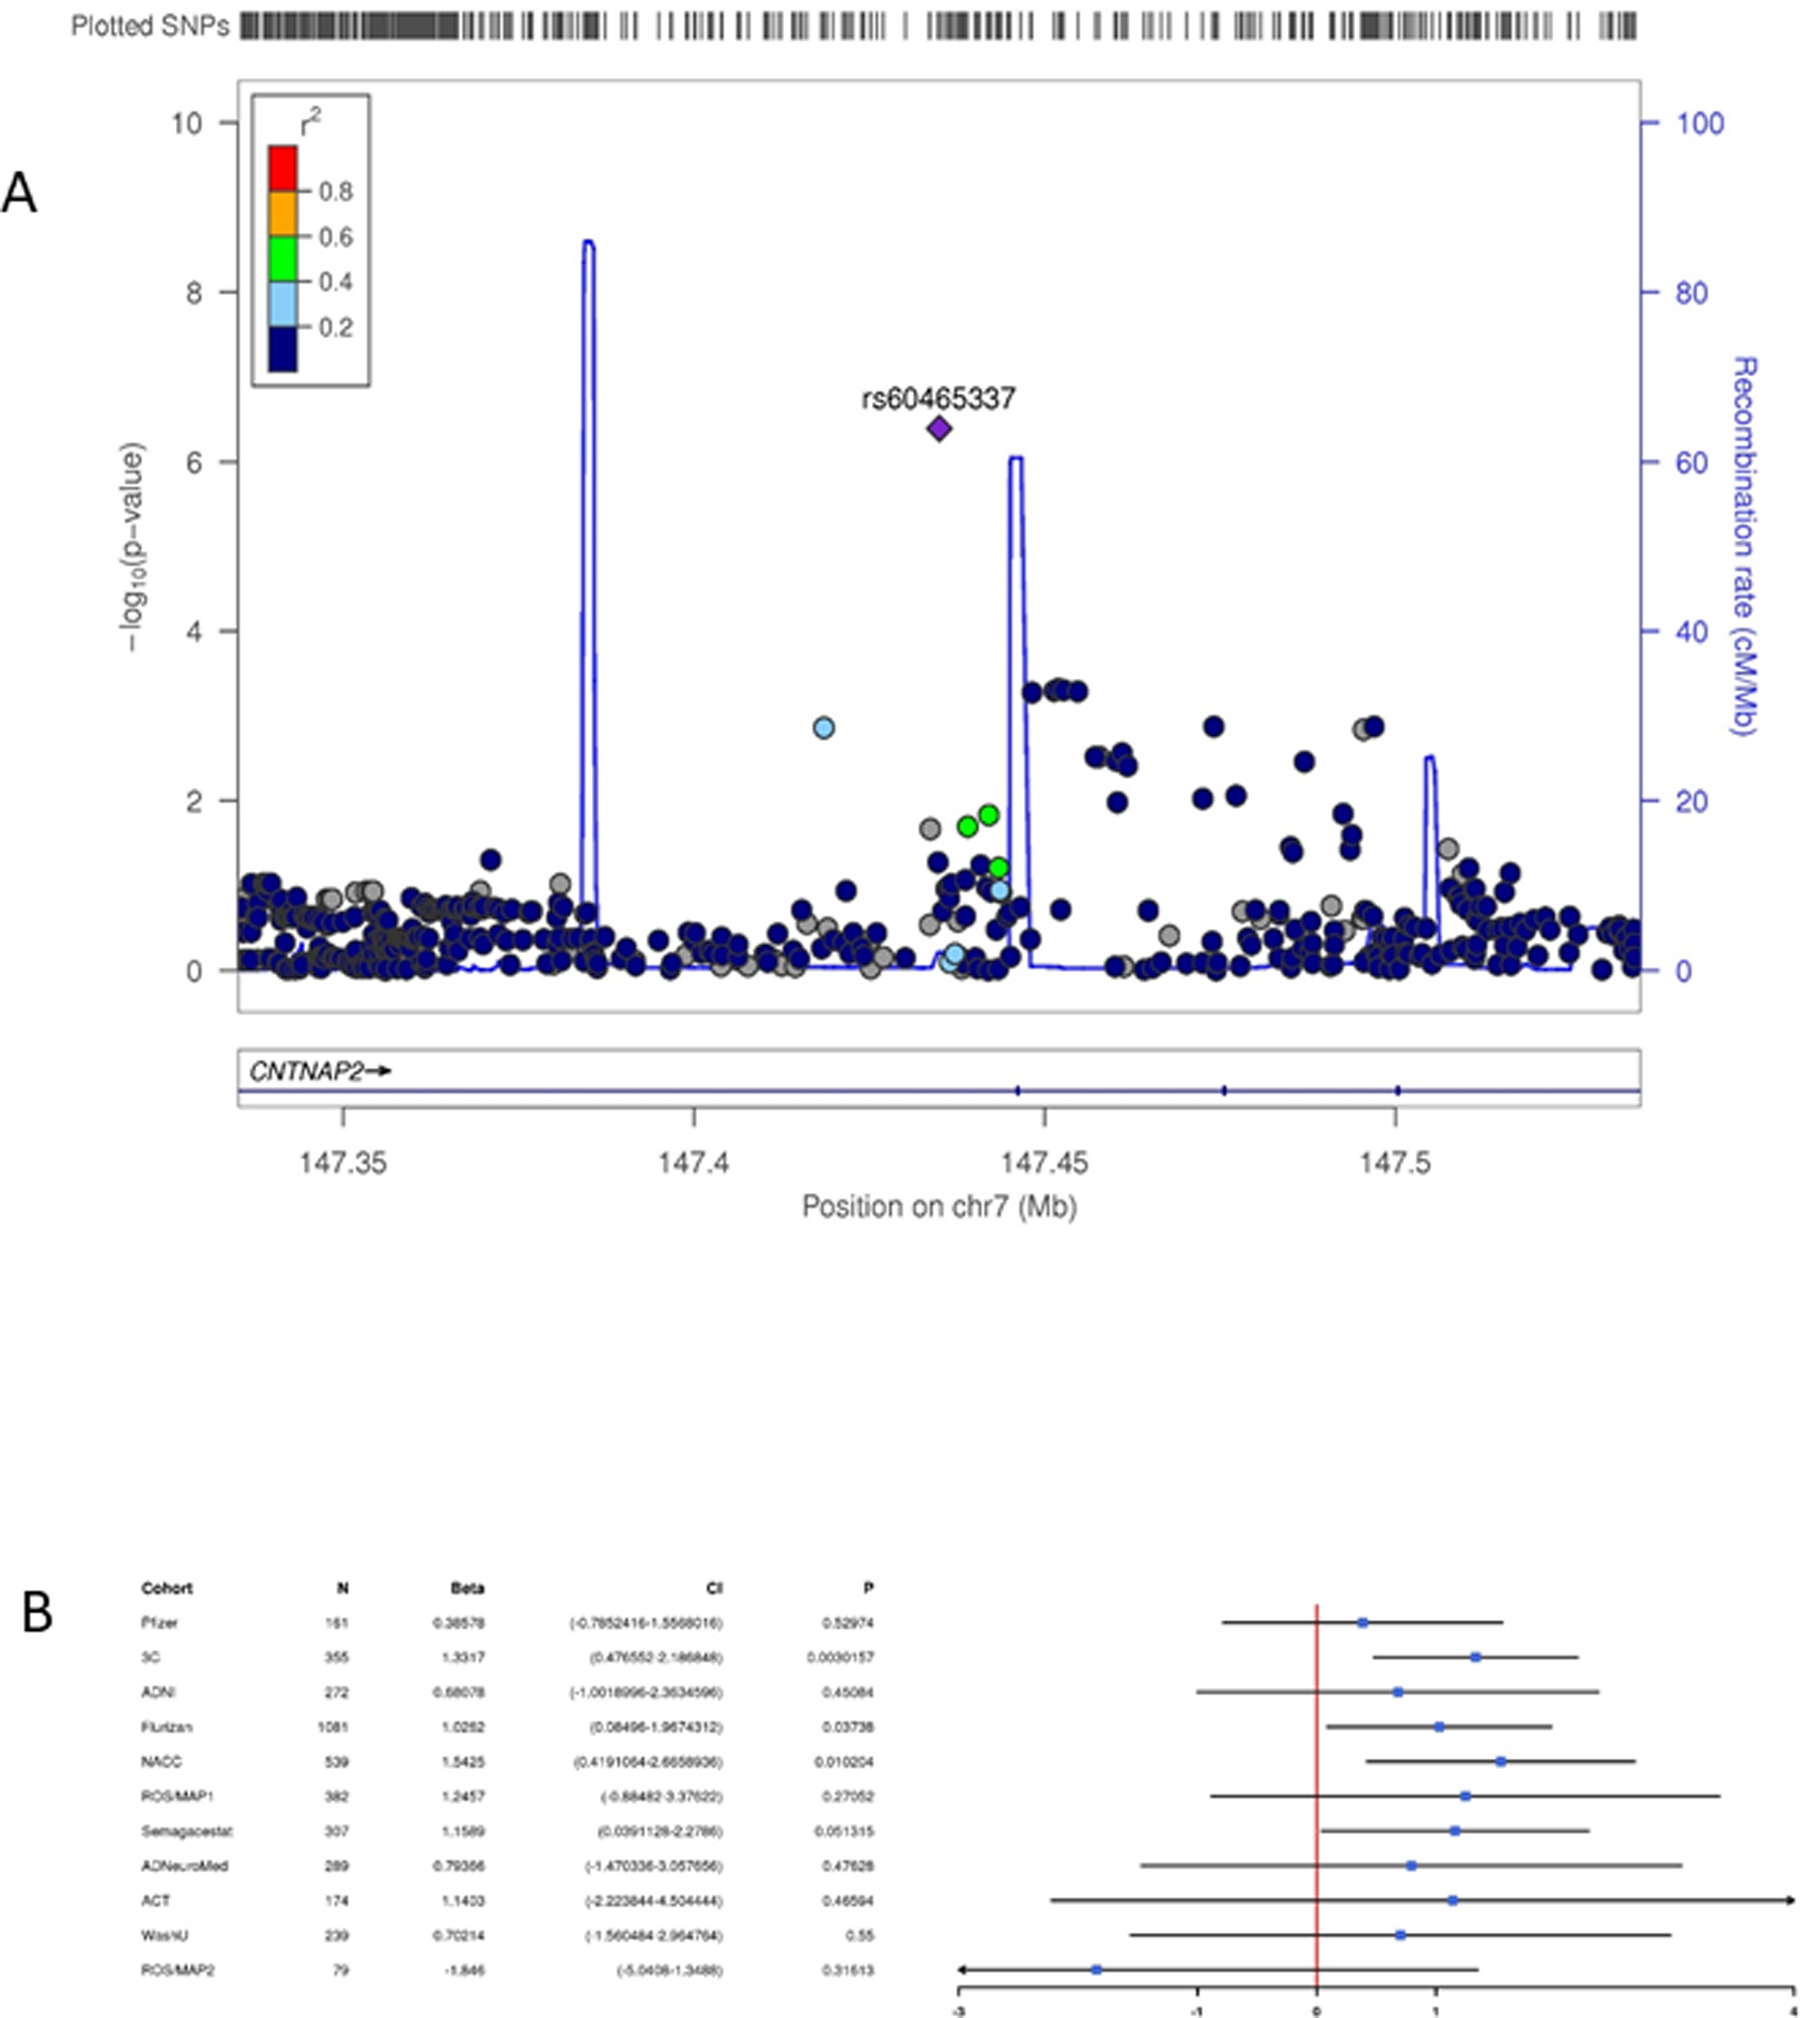
Figure 2. Association results for contactin-associated protein 2 on chromosome 7.

Regional Manhattan plot (A) and forest plot (B) showing the full generalized estimating equations model results for the region containing contactin-associated protein 2 on chromosome 7. SNPs are color coded according to their linkage disequilibrium with the lead SNP in the region. The forest plot shows the beta and associated 95% confidence interval in each cohort.
