
Fig. 1.
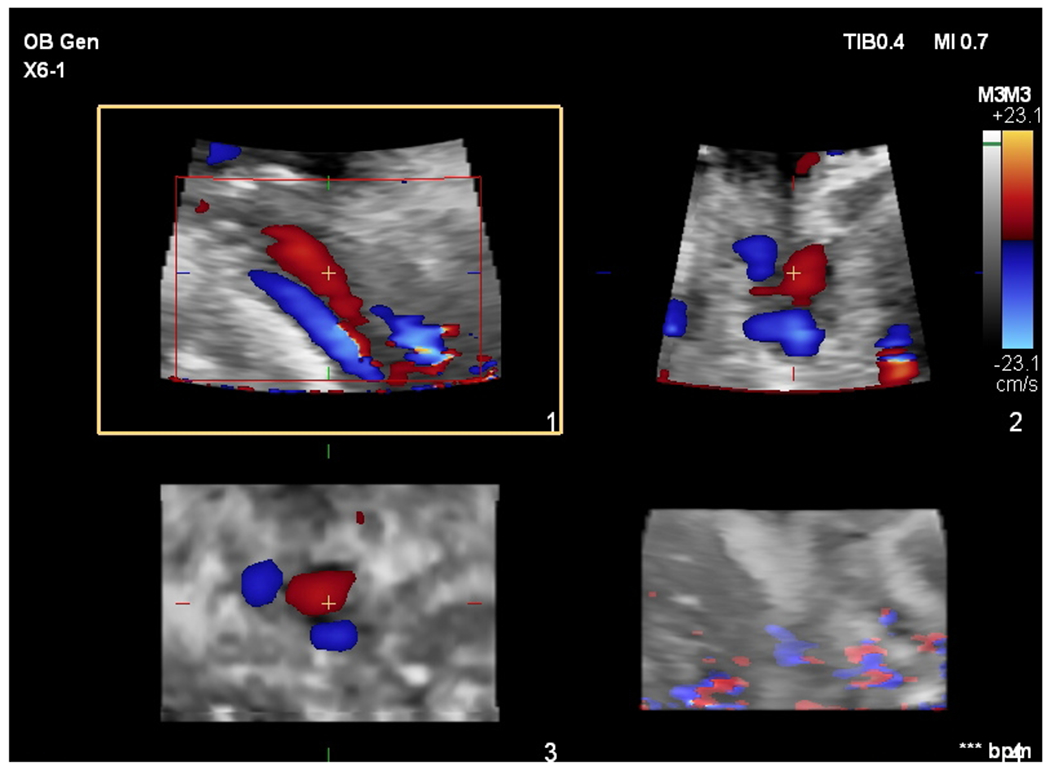
a: Color flow images of the vessels in the umbilical cord in one of the sampling positions for subject 12 in this study. The umbilical arteries are blue and the umbilical vein is red. A “+” is positioned in the umbilical vein identifying a 3D point that coincides in the 3 acquired views. The upper left (axial-lateral) image with a square around it and labeled 1 at the lower right edge is an image along the length of the vein and one of the arteries. The upper right (axial-elevational) image, image 2, is perpendicular to image 1. It would correspond to a transverse image if image 1 is a longitudinal image of the umbilical vein and umbilical arteries. The lower left (elevational-lateral) image, image 3, is the C-surface or Gaussian surface image from which volume flow is calculated. Summing the local flux measurements across the vein (red) in this image produces a volume flow estimate. The lower right image corresponds to a 3D rendering in which the vessels are poorly visualized – this view is not used when positioning the cord in the C-surface, nor for volume flow measurement. Color bar indicates velocity in centimeters per second.
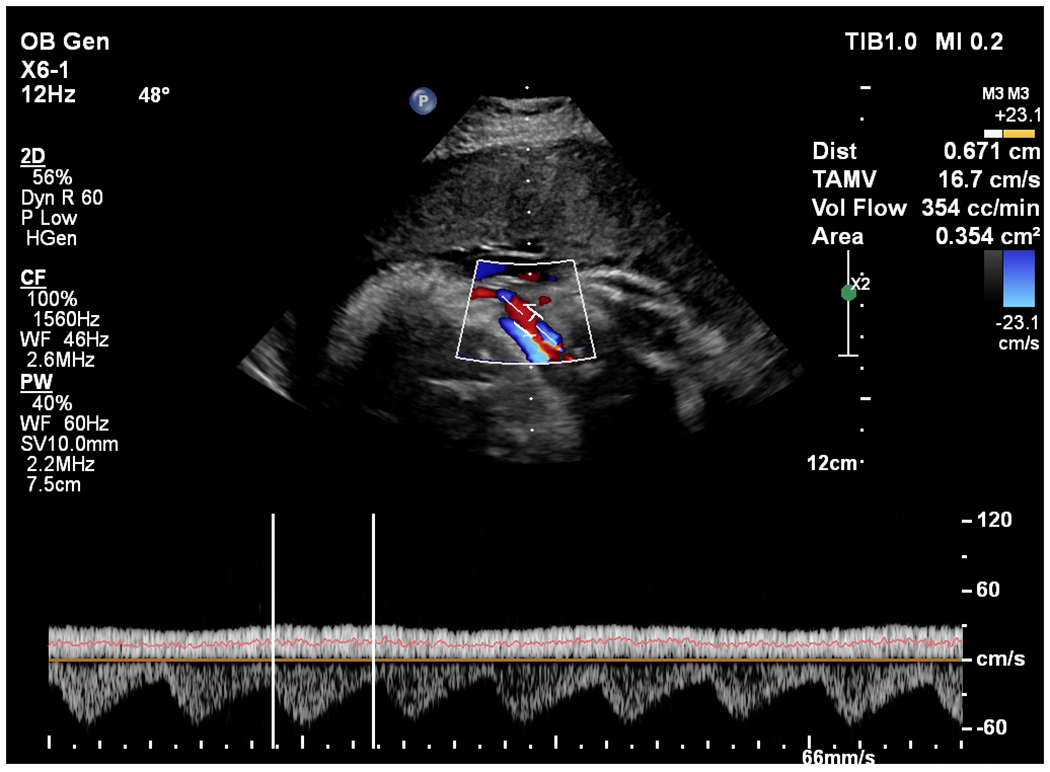
b: Color flow image and angle-corrected spectral Doppler estimate for volume flow in subject 12. The angle correction (48°) and vessel diameter (0.671 cm) estimates are shown. The venous spectral trace with the mean estimate represented by the orange line through the venous trace is shown at the bottom of the image. The two white vertical bars on the trace indicate the time interval used for averaging. The volume flow estimate is 354 cc/min and is computed using the average flow velocity (TAMV = 16.7 cm/s) and the area estimate based on the diameter measurement (0.354 cm2). Color bar indicates velocity in centimeters per second.