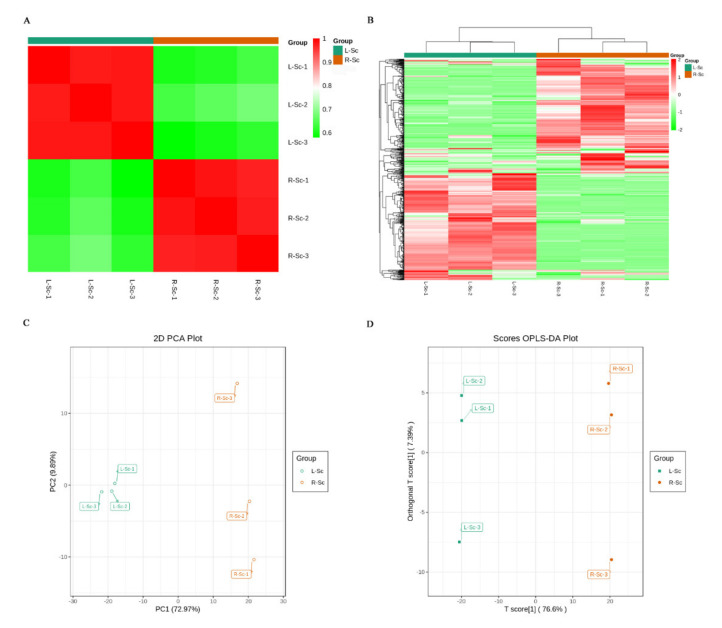
Figure 3.
The identified metabolites analysis. (A) Pearson’s correlation coefficients among the L-Sc and R-Sc samples. (B) Cluster analysis of the identified metabolites from the L-Sc and the R-Sc. (C) Principal component analysis (PCA) of the L-Sc and R-Sc. (D) Orthogonal partial least squares discriminant analysis (OPLS-DA) model plot of the identified metabolites in the L-Sc and the R-Sc.

