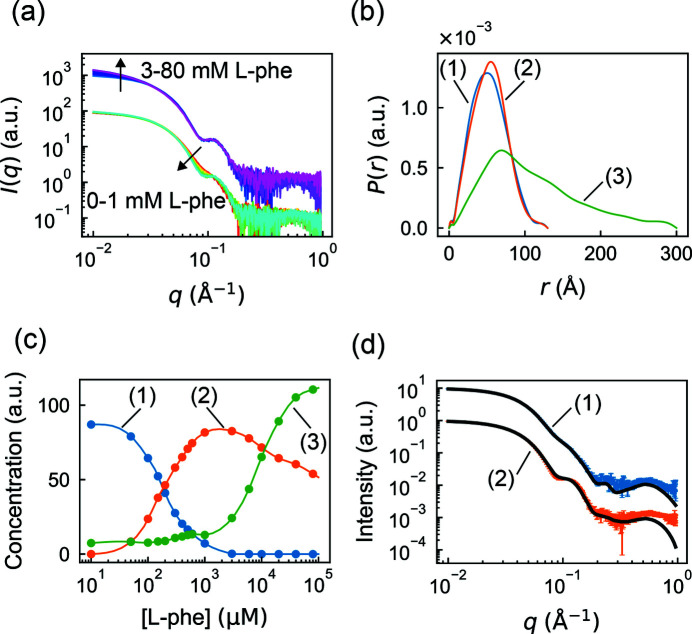
Figure 4.
Separation of aggregation from ligand-induced conformational changes in a titration dataset with real-space regularization in REGALS. (a) Scattering profiles from a previously reported phenylalanine (l-phe) titration experiment on PheH (Meisburger et al., 2016 ▸). Up to 1 mM l-phe (red to cyan), the change in scattering occurs mainly at mid q, corresponding to internal conformational changes. At [l-phe] greater than 1 mM (blue to magenta), an increase at low q can be observed, indicative of aggregation. The two sets of profiles are offset for clarity. (b) Regularized P(r) functions from REGALS deconvolution. Different cut-offs for P(r) functions differentiate aggregation (green) from normal conformations (blue and orange). (c) Concentration profiles from REGALS deconvolution (continuous curves) are consistent with observations from panel (a), with conformational switching occurring below 1 mM l-phe and aggregation gradually becoming dominant above 1 mM l-phe. Circles show unregularized concentrations [equation (27)]. (d) Extracted profiles for components (1) and (2) agree with the scattering profiles of inactive and activated PheH, respectively. Here, the black curves are the P(r) regularized scattering profiles from SEC-SAXS (Meisburger et al., 2016 ▸).

