Figure 5.
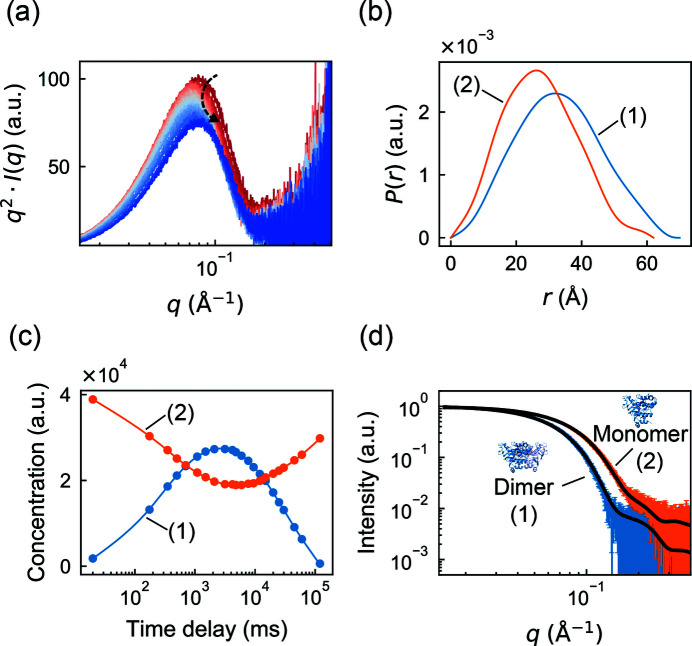
Model-free deconvolution of a time-resolved mixing dataset in REGALS. (a) Scattering profiles from a previously reported time-resolved mixing experiment with MsbA NBD and ATP (Josts et al., 2020 ▸) shown as Kratky plots (red to blue). The peak position shifts to q ∼ 0.07 Å−1 before returning to q ∼ 0.08 Å−1 (denoted by the curved arrow), indicating a transient increase in size. (b) Regularized P(r) functions of dimer (blue) and monomer (orange) components have well defined shapes with d max estimates based on the crystal structure of full-length dimeric MsbA (PDB ID 3b60). (c) Concentration profiles from REGALS deconvolution (continuous curves) and unregularized concentrations (circles), showing transient formation of the NBD dimer. (d) The extracted scattering profiles of components (1) and (2) agree with predictions using the NBD dimer and monomer from the full-length crystal structure [black curves are CRYSOL (Svergun et al., 1995 ▸) fits].

