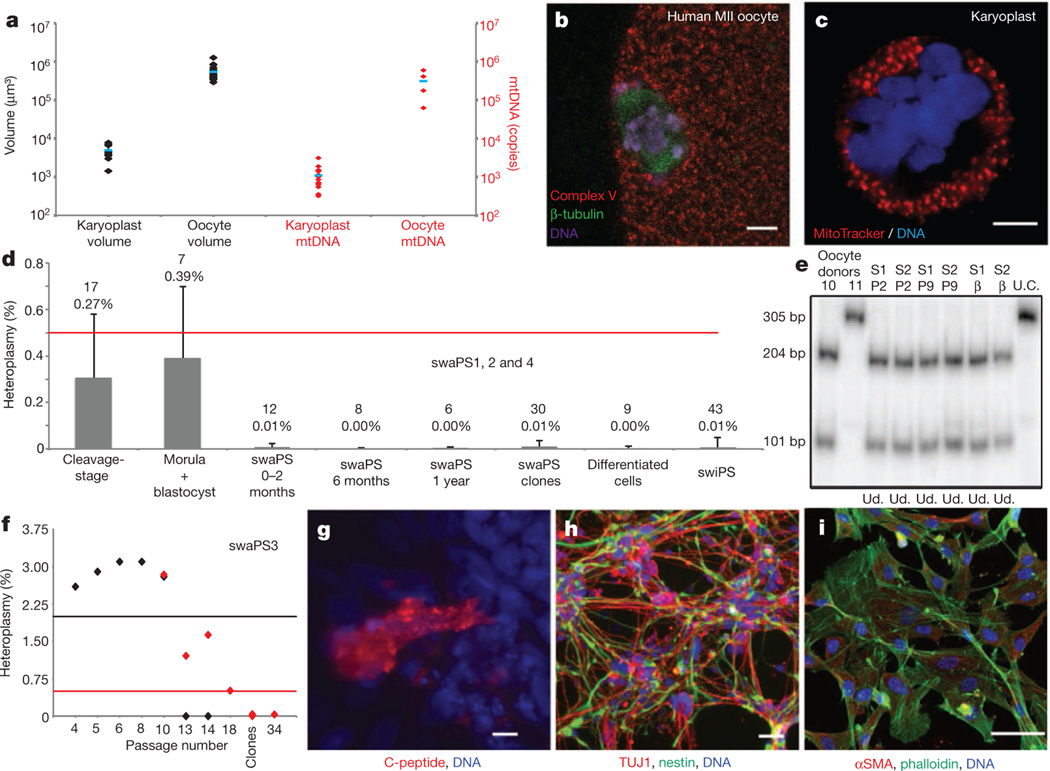
Figure 3 |. Low levels of mtDNA carryover.
a, Volume (black) and mtDNA copies (red) of karyoplasts and oocytes. Blue barsdenote themean. b, c, Distribution of mitochondria in the oocyte (b) and the karyoplast (c). d, Mean heteroplasmy quantification by ARMS-qPCR. Red line indicates limit of detection. Error bars indicate s.d., with the mean value and n number shown. e, RFLP analysis of swaPS1 and swaPS2 (S1 and S2, respectively) at P2 and P9 and as β-cells. bp, base pairs; U.C., undigested control; Ud., undetectable. f, Heteroplasmy in swaPS3 cells. ARMS-qPCR (red diamonds) and RFLP (black diamonds); black and red lines indicate detection limits. g–i, Directed differentiation into β-cells (g), neurons (h) and fibroblasts (i). αSMA, α-smooth muscle actin. Scale bars, 5 μm (b, c) and 50 μm (g–i).

