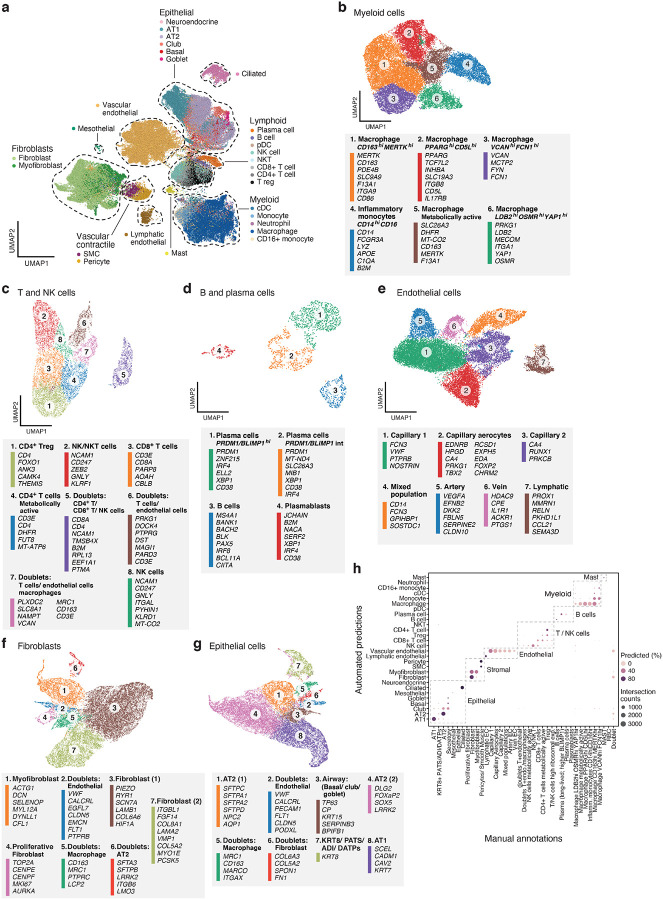
Figure 2. A single cell and single nucleus atlas of COVID-19 lung.
a. Automatic prediction identifies cells from 28 subsets across epithelial, immune and stromal compartments. UMAP embedding of 106,792 harmonized scRNA-Seq and snRNA-Seq profiles (dots) from all 16 COVID-19 lung donors, colored by their automatically predicted cell type (legend). b-g. Refined annotation of cell subsets within lineages. UMAP embeddings of each selected cell lineages with cells colored by manually annotated sub-clusters. Color legends highlight highly expressed marker genes for select subsets. b. myeloid cells (24,417 cells/ nuclei), c. T and NK cells (9,950), d. B and plasma cells (1,693), e. endothelial cells (20,366), f. fibroblast (20,925), g. epithelial cells (21,700). h. High consistency between automatic and manual annotations. The proportion (color intensity) and number (dot size) of cells with a given predicted annotation (rows) in each manual annotation category (columns).

