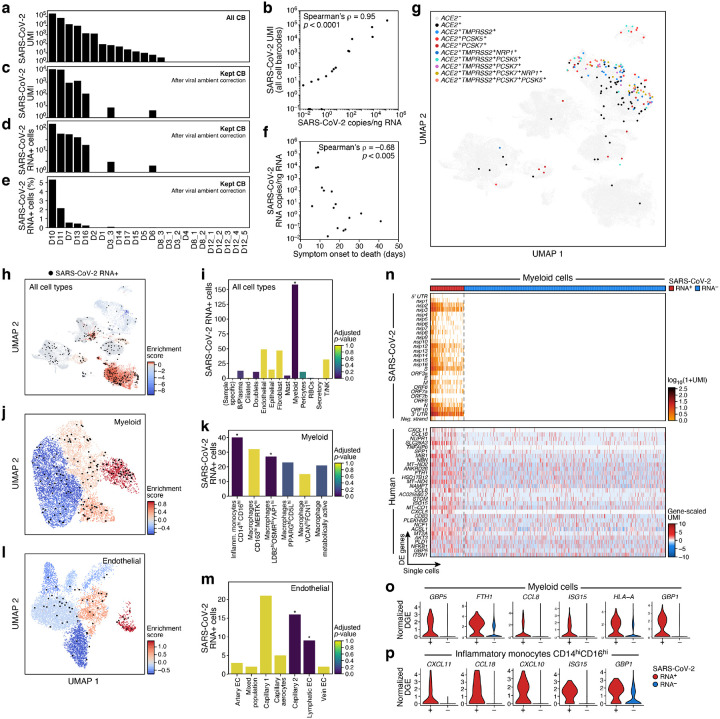
Figure 4. SARS-CoV-2 RNA+ single cells span multiple lineages and are enriched among phagocytic and endothelial cells.
a-e. Robust identification of SARS-CoV-2 RNA+ single cells. a. Number of SARS-CoV-2 UMIs from all cell barcodes (y axis). c. Number of SARS-CoV-2 UMIs after ambient correction. d. and e. Number (d, y axis; Range: 1–169, total: 342, mean +/− SEM: 49 +/− 22) and percent (e, y axis, Range: 0.02–5.3%, mean +/ SEM 1.25% +/− 0.73%) of SARS-CoV-2+ RNA cells (both after ambient correction), across the samples (x axis), ordered by ranking in a. b. Agreement of overall viral RNA abundance from sc/snRNA-Seq and qPCR on bulk RNA. SARS-CoV-2 copies as measured by CDC N1 qPCR assay on bulk RNA extracted from matched tissue samples (x axis) and from number of all SARS-CoV-2 aligning UMI (pre-ambient correction, y axis). f. Reduction in SARS-CoV-2 RNA with more prolonged S/s interval. Interval between symptom onset and death (x axis, days) and lung SARS-CoV-2 copies/ng input RNA (y axis) for each donor. g. SARS-CoV-2 RNA+ single cells are not closely related to expression of the SARS-CoV-2 entry factors. UMAP embedding (as in Fig. 2a) of all cells/nuclei profiled in the lung, colored by single and multi-gene expression of the SARS-CoV-2 entry factor ACE2 with different accessory proteins. Co-expression combinations with at least 10 cells are shown. h-m. SARS-CoV-2 RNA+ cells are enriched in specific lineages and sub-types. Left panels, h, j, l: Cells from 7 donors containing any SARS-CoV-2 RNA+ cell, and colored by viral enrichment score (color bar; red: stronger enrichment) and by SARS-CoV-2 RNA+ cells (black points). UMAP embeddings of either all cell types (h, as in Supplemental Fig. 4a), myeloid cells (j, as in Fig. 2b), or endothelial cells (l, as in Fig. 2e). Right panels, i, k, m: Number of SARS-CoV-2 RNA+ cells (y axis) per cell type/subset (x axis), with bars colored by enrichment score (color bar. dark blue: stronger enrichment). * FDR < 0.01. n-p. Expression changes in SARS-CoV-2 RNA+ myeloid cells. n. Expression of SARS CoV-2 genomic features (top, log-normalized UMI counts; rows) and significantly DE host genes (bottom, log-normalized and scaled digital gene expression, rows; FDR-corrected p-value < 0.05 and log2 fold change > 0.5) across SARS-CoV-2 RNA+ and SARS-CoV-2 RNA− myeloid cells (columns). o,p. Distribution of normalized digital expression levels (y axis) for select significantly DE genes between SARS-CoV-2 RNA− and SARS-CoV-2 RNA+ cells from myeloid cells (o) or from Inflammatory monocytes CD14highCD16high cells (p).

