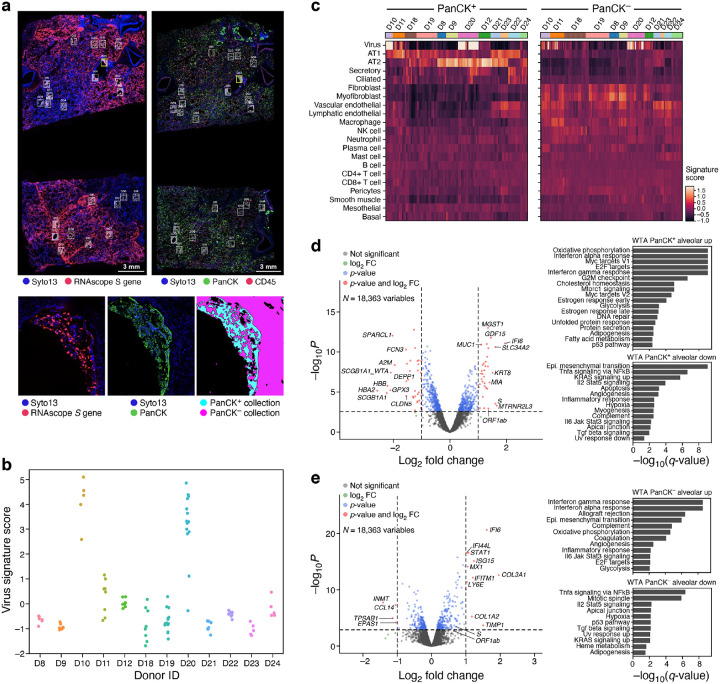
Figure 5. Spatial atlas of autopsy lung samples highlight composition and expression differences between infected and uninfected regions and with healthy lungs.
a. Selection of ROIs and AOIs. Top: overview scans of donor D20 showing S gene RNAscope (left) and immunofluorescent staining (right). ROIs for CTA collection (right) are associated with RNAscope images (left) (white rectangles). Bottom: Zoom in of one ROI (yellow rectangle) from each scan (left and middle), and the defined segmentation masks for collection (right). b. Differences in viral load within regions and between donors. Viral signature score (y axis) for each WTA AOI (dots) in each donor (x axis). c. Deconvolution highlights differences in cell composition between PanCK+ and PanCK− alveolar AOIs and between AOIs from SARS-CoV-2 (D22–24) and SARS-CoV-2 positive (all others) lung samples. Expression scores (color bar) of cell type signatures (rows) in PanCK+ (left) and PanCK− (right) alveolar AOIs (columns) in WTA data from different donors (top color bar). d,e. Changes in gene expression in SARS-CoV-2 positive vs. negative lung. Left: Significance (−Log10(P-value), y axis) and magnitude (log2(fold-change), x axis) of differential expression of each gene (points) in WTA data between SARS-CoV-2 positive and negative AOIs for PanCK+ (d) and PanCK− (e) alveoli. PanCK+ alveoli ROIs: 78 SARS-CoV-2 positive vs. 18 negative; PanCK− alveoli ROIs: 112 positive vs. 20 negative. The horizontal dashed line indicates an FDR q-value cutoff of 0.05, and the two vertical dashed lines represent a fold-change of 2 in log2 scale. The names of top 10 SARS-CoV-2 positive and negative significant genes regarding fold-change are marked, respectively. Right: Significance (−log10(q-value)) of enrichment (permutation test) of different pathways (rows).

