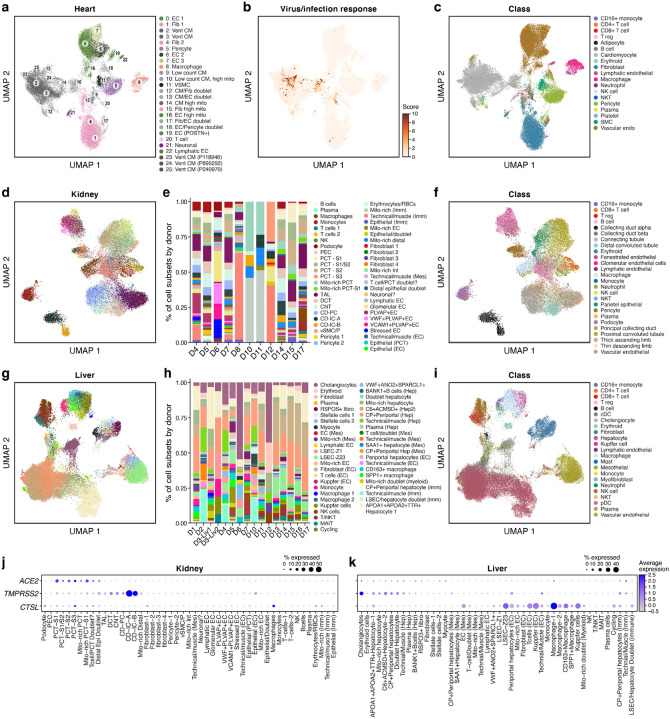
Figure 6. A single nucleus atlas of heart, kidney, and liver COVID-19 tissues.
a-c. COVID-19 heart cell atlas. UMAP embedding of 36,662 heart nuclei (dots) from 15 samples, colored by clustering with manual post hoc annotations (a), signature scores of genes upregulated in SARS-CoV-2 infected iPSC cardiomyocytes55 (b), labeling mostly cardiomyocytes from patient D17 (see also Supplemental Fig. 10b–g), or by automatically derived cell type labels (c). d-f. COVID-19 kidney cell atlas. d,f. UMAP embedding of 29,568 kidney nuclei (dots) from 11 samples, colored by clustering with manual post hoc annotations (d) or by automatically derived cell type labels (f). e. Proportion of cells (y axis) in each subset (color legend, as in d) in each donor (x axis). g-i. COVID-19 liver cell atlas. g,i. UMAP embedding of 47,001 liver nuclei (dots) from 16 samples, colored by clustering with manual post hoc annotations (g) or by automatically derived cell type labels (i). h. Proportion of cells (y axis) in each subset (color legend, as in g) in each donor (x axis). j,k. SARS-CoV-2 entry factors are expressed in kidney and liver cells. Average expression (dot color) and fraction of expressing cells (color, size) of SARS-CoV-2 entry factors (rows) across cell subsets (columns) in the kidney (j) and liver (k).

