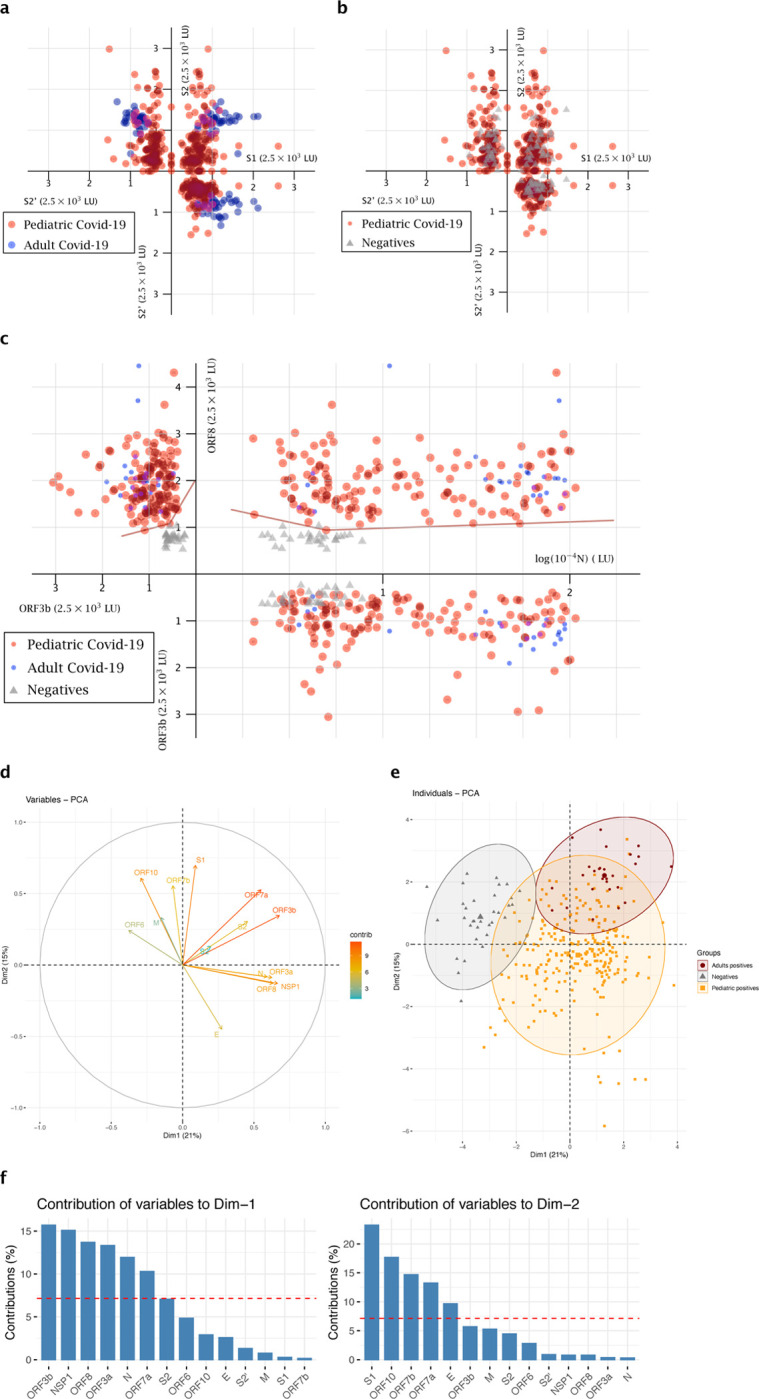
Figure 3. Representation of the pediatric COVID-19 population as a cluster of points for relevant antibody combinations and Principal Component Analysis (PCA).

(a-b). Cluster representation of S1, S2’, S2 antibodies combination. (a) shows the pediatric COVID-19 population versus the adult COVID-19 population, (b) shows the pediatric COVID-19 population versus the negative population. (c) Cluster representation of N, ORF3b, ORF8 antibodies combination, for the pediatric COVID-19 population versus the adult COVID-19 population and the negative population. Patients are presented according to their values of SARS-CoV-2 individual LIPS antibodies as (x, y, z) in the space. Pediatric COVID-19 patients (n=144) are represented as red dots. COVID-19 adult patients (n=36 in (a-b) and n=24 in (c)) are represented in blue. The negative population (n=28) is represented in gray. (d-f) PCA of 14 antibodies analyzed in COVID-19 pediatric patients. Dim1 explains 21% of the variation, while Dim2 explains 15% of the variation. (d) Correlation circle and contributions. The scale of contributions is indicated (right). (e) Contribution of variables on dimensions 1 and 2. The red dashed line on the graph above indicates the expected average contribution. (f) Factorial plot of PCA on dimension 1 and 2. The plot is colored by sample types, the largest point in shape in each group is the group mean point (circle is for Adult positives, triangle for Negatives and squares for Pediatric positives).
