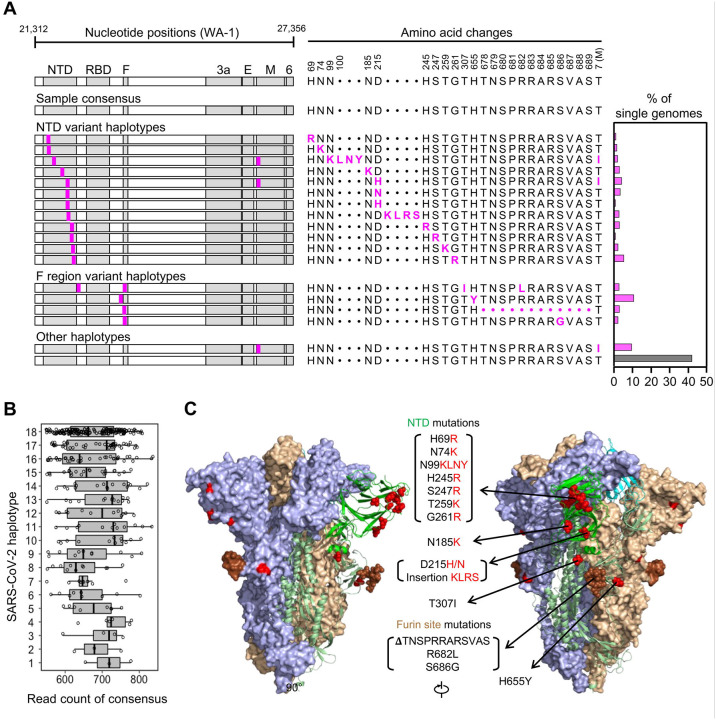
Fig 2. Analysis of SARS-CoV-2 genetic diversity in vitro.
(A) Haplotype diagrams (left) depicting SARS-CoV-2 SGS detected in a 4th-passage Vero cell culture of the WA-1 reference clinical isolate. Spike NH2-terminal domain (NTD), receptor-binding domain (RBD), and furin cleavage site (F) regions are shaded grey, with remaining regions of spike in white. Pink tick marks illustrate mutations relative to the sample consensus sequence. Amino acid changes corresponding to these mutations are shown in sequence alignment form (middle), with the percentage of all SGS in the sample matching each haplotype shown in the bar graph (right). The grey bar in the graph indicates the haplotype that matches the sample consensus sequence; variant haplotypes with at least 1 mismatch to sample consensus are in pink. (B) Read counts of each UMI bin for which the SARS-CoV-2 sequence matched each of 18 different haplotypes in Vero cell culture of the WA-1 clinical isolate. Bars indicate median read counts among bins. (C) Mapping of detected spike gene mutations on the trimer structure. Two protomers of the SARS-CoV-2 spike (PDB ID: 6zge) are shown in surface representation and colored light blue and wheat, respectively. The third protomer is shown in cartoon representation with the NTD region colored in bright green. NTD mutations as well as T307I and H655Y are shown in red and the furin cleavage site mutations are in brown. The molecular structures were prepared with PyMOL (https://pymol.org).

