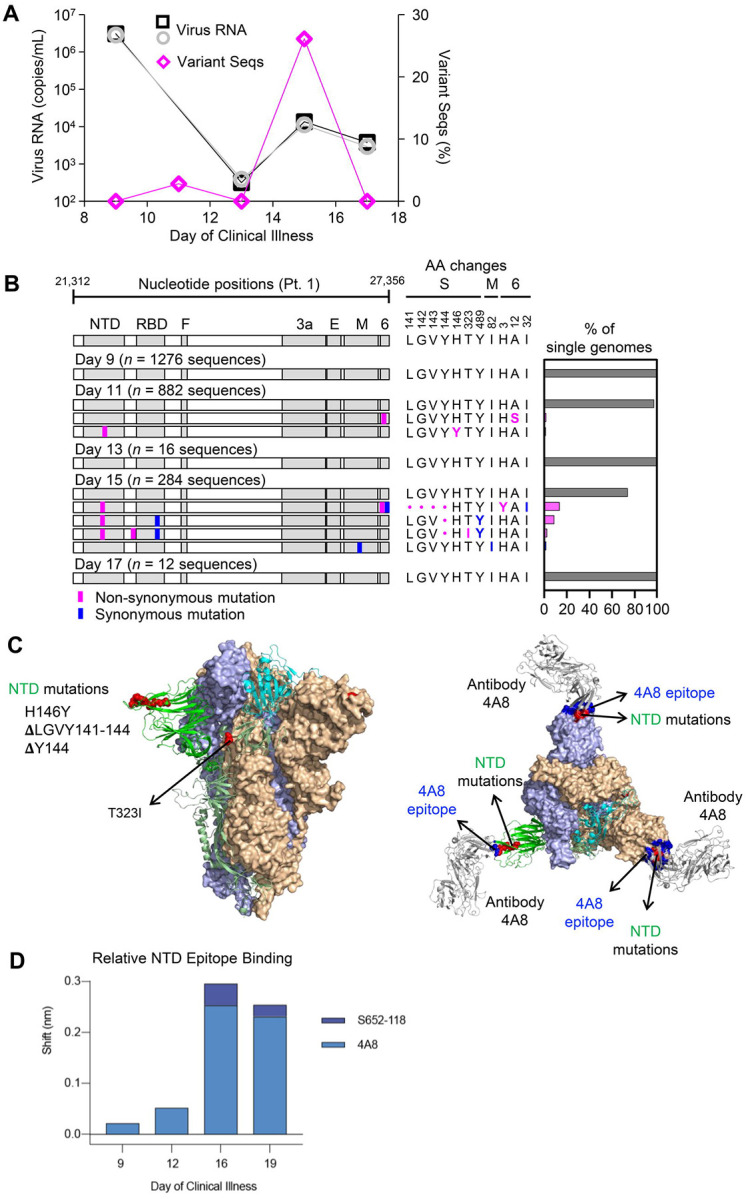
Fig 5. Longitudinal analysis of SARS-CoV-2 RNA burden, SGS, and epitope-specific antibody binding to spike in participant 1.

(A) Copy numbers of SARS-CoV-2 N1 (black squares) and N2 (grey circles) RNA (left y-axis) and percentage of SGS not matching the predominant/consensus haplotype (pink diamonds, right y-axis) plotted for upper respiratory tract samples from days 9–17. (B) Variant haplotypes of the SARS-CoV-2 virion surface protein gene region detected on days 9, 11, 13, 15, and 17. The number of SGS obtained at each day is in parentheses. Haplotype diagrams (left), amino acid changes (middle), and percentages of all SGS in the sample attributable to indicated haplotypes (right) are as in Fig 2 and 3. The haplotype matching the consensus for each sample is represented in grey; variant haplotypes with at least 1 non-synonymous mismatch to sample consensus are in pink; one variant haplotype differing from sample consensus by only a synonymous mismatch is in blue. (C) Mapping of detected spike gene mutations on the trimer structure, viewed from the side (left) and top (right). The protomers in the spike (PDB ID: 6zge) were shown and colored with the same scheme as in Fig 2C. Detected mutations are highlighted in red. Antibody 4A8 (PDB ID: 7c21) is shown to bind to NTD with its epitope (blue) overlapping with the detected NTD mutations (right). The molecular structures were prepared with PyMOL (https://pymol.org). (D) Relative contribution of NTD epitope-specific serum antibodies to total NTD domain-specific binding on days 9, 12, 16, and 19. Plotted results represent averages of 2–4 replicate experiments for each condition.
