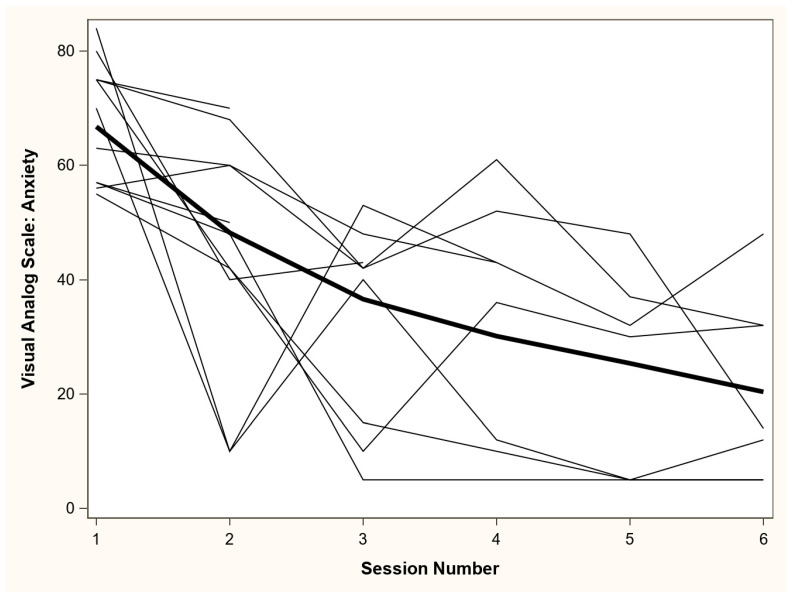
Figure 1.
Visual Analog Scale-Anxiety (VAS-A) scores across self-management intervention session. VAS-A scores range from “not anxious at all” (score = 0) to “most anxious I have ever felt” (score = 100). The bold line represents a locally estimated scatterplot smoothing (LOESS) regression line across all data points, and all other lines represent values from each patient across each of the self-management sessions.

