. 2021 Mar 1;41(2):524–542. doi: 10.1148/rg.2021200056

Figure 16c.

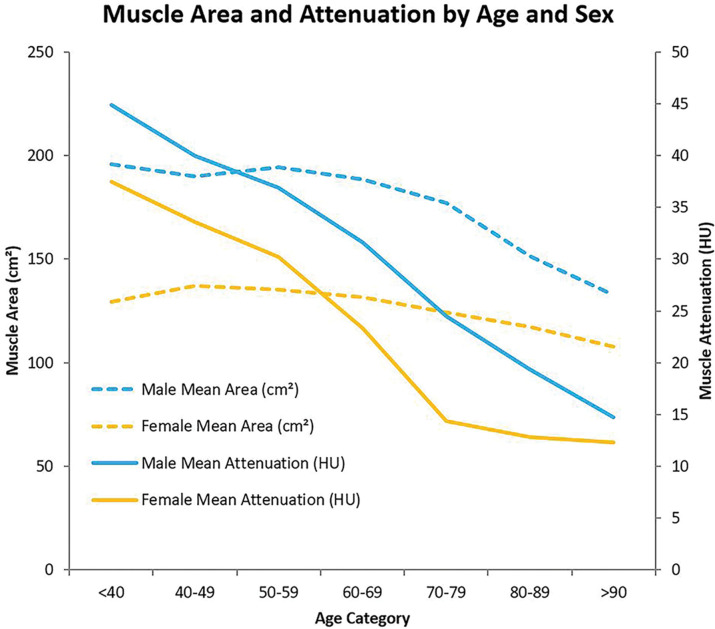
Automated muscle segmentation at abdominal CT. (a) Axial CT image at the L3 level in a 50-year-old man shows the automatically segmented muscle (red shading). (b) Graph of automated CT-based muscle area and attenuation differences according to subject age shows that muscle attenuation (red line) decreases at a greater rate with aging compared with the cross-sectional area (blue line). (c) Graph shows that this trend exists for both men and women. After age 70, both muscle attenuation and area values plateau more in women than in men. (Reprinted, with permission, from reference 19.)

Automated muscle segmentation at abdominal CT. (a) Axial CT image at the L3 level in a 50-year-old man shows the automatically segmented muscle (red shading). (b) Graph of automated CT-based muscle area and attenuation differences according to subject age shows that muscle attenuation (red line) decreases at a greater rate with aging compared with the cross-sectional area (blue line). (c) Graph shows that this trend exists for both men and women. After age 70, both muscle attenuation and area values plateau more in women than in men. (Reprinted, with permission, from reference 19.)