. 2021 Feb 19;41(2):509–523. doi: 10.1148/rg.2021200049

Figure 10a.

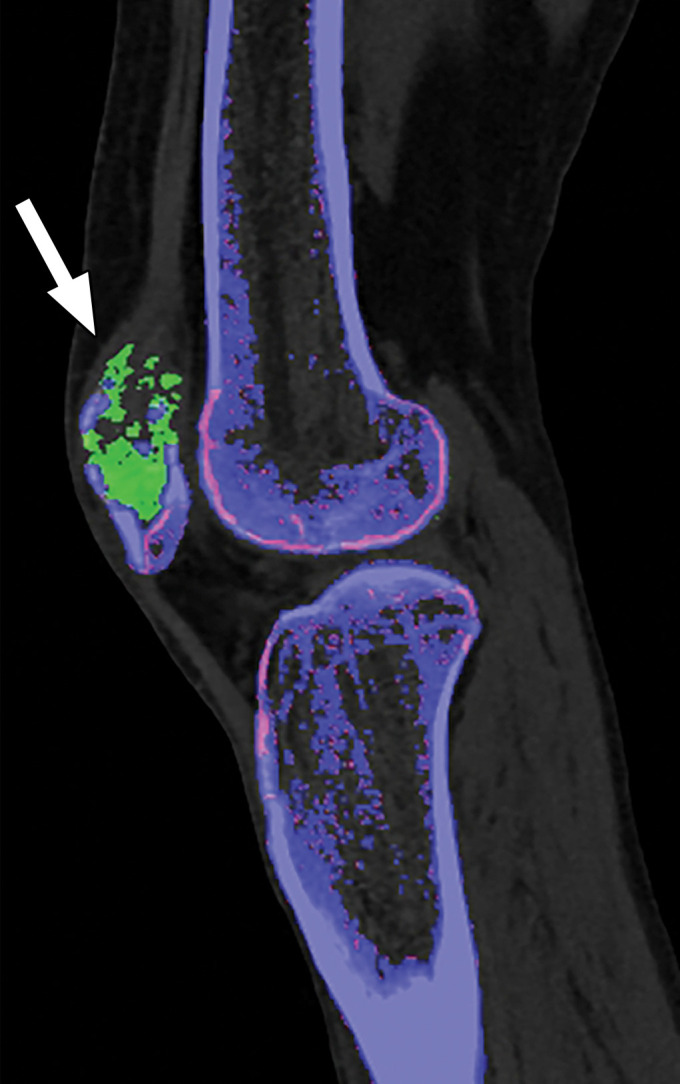
Appropriate selection of postprocessing attenuation threshold. Sagittal color overlay MD-urate images obtained with dual-source DECT for gout evaluation show monosodium urate deposition (green) in the soft tissue associated with the lytic lesion involving the patella (arrow). Image processed using 120 HU as the minimum attenuation threshold (a) shows a larger (6.77 cm3) and more accurate representation of the tophus deposit compared with the image processed using 150 HU as the threshold (b) (3.39 cm3).

Appropriate selection of postprocessing attenuation threshold. Sagittal color overlay MD-urate images obtained with dual-source DECT for gout evaluation show monosodium urate deposition (green) in the soft tissue associated with the lytic lesion involving the patella (arrow). Image processed using 120 HU as the minimum attenuation threshold (a) shows a larger (6.77 cm3) and more accurate representation of the tophus deposit compared with the image processed using 150 HU as the threshold (b) (3.39 cm3).