
Figure 12b.
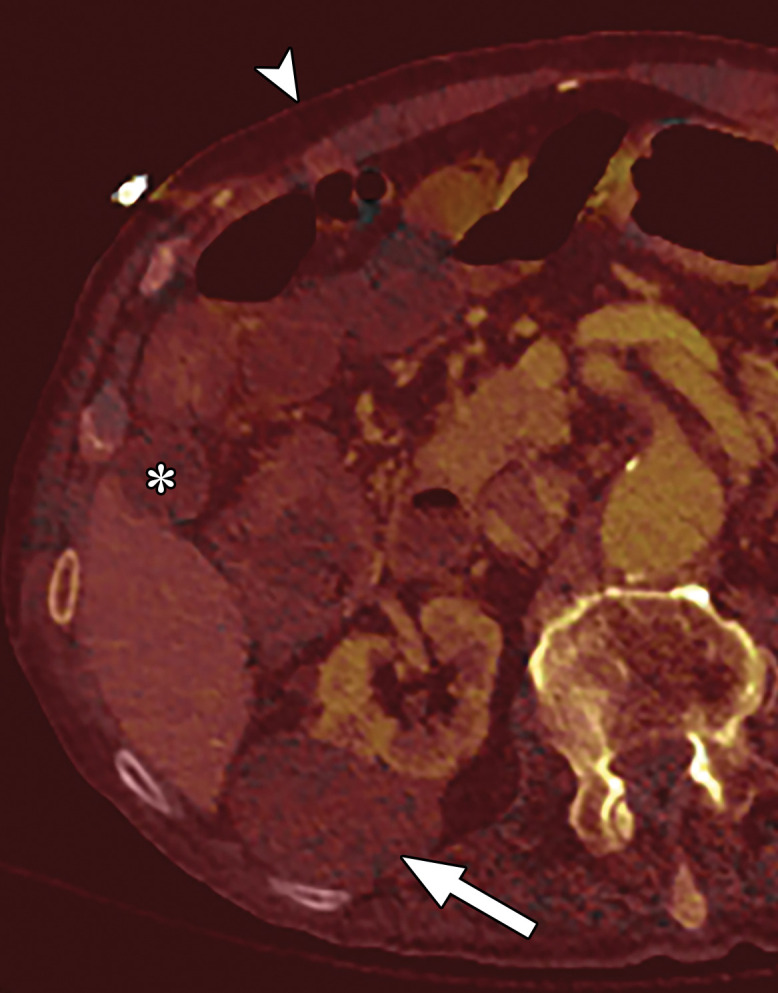
Optimization of window settings for MD-iodine images. (a) Axial single-energy–equivalent image shows a simple fluid-attenuation cyst in the right kidney (arrow). (b) Axial color overlay MD-iodine image shows spurious uptake of iodine (dark red) by the cyst (arrow) due to improper window settings. Also note the false presence of iodine in the gallbladder (*), subcutaneous fat (arrowhead), and air. (c) Axial color overlay MD-iodine image with appropriate window display shows lack of iodine in the cyst (arrow).