. 2021 Feb 19;41(2):509–523. doi: 10.1148/rg.2021200049

Figure 1c.

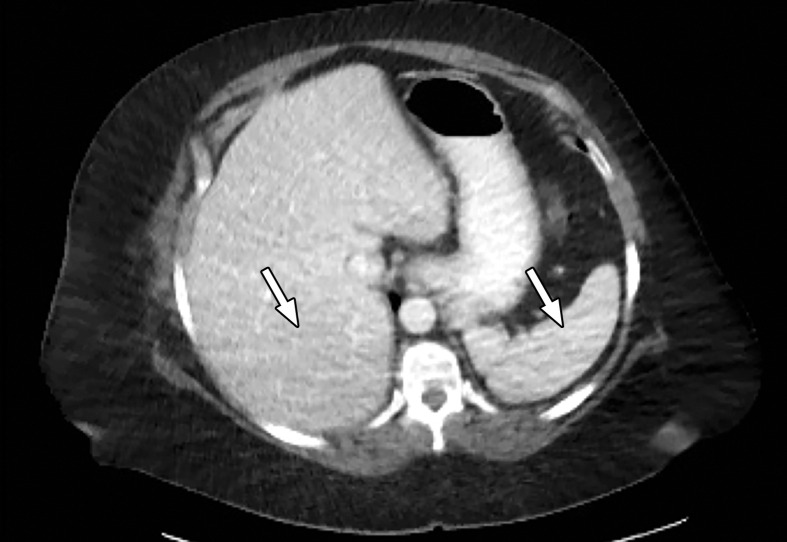
Photon starvation in a large patient. Axial portovenous phase abdominopelvic CT was performed in a 242-lb (110-kg) patient using rapid kilovolt peak (kVp) switching DECT. (a) Material density (MD)–iodine image shows dark bands of artifact (arrows) across the liver and spleen. (b) On an MD-water image, the streaks appear as bright bands (arrows). (c) On a 65 kilo–electron volt (keV) image, the artifacts are much less apparent (arrows). (d) On a 140 kVp–equivalent image, the artifacts are not visualized.

Photon starvation in a large patient. Axial portovenous phase abdominopelvic CT was performed in a 242-lb (110-kg) patient using rapid kilovolt peak (kVp) switching DECT. (a) Material density (MD)–iodine image shows dark bands of artifact (arrows) across the liver and spleen. (b) On an MD-water image, the streaks appear as bright bands (arrows). (c) On a 65 kilo–electron volt (keV) image, the artifacts are much less apparent (arrows). (d) On a 140 kVp–equivalent image, the artifacts are not visualized.