. 2021 Feb 19;41(2):509–523. doi: 10.1148/rg.2021200049

Figure 6c.

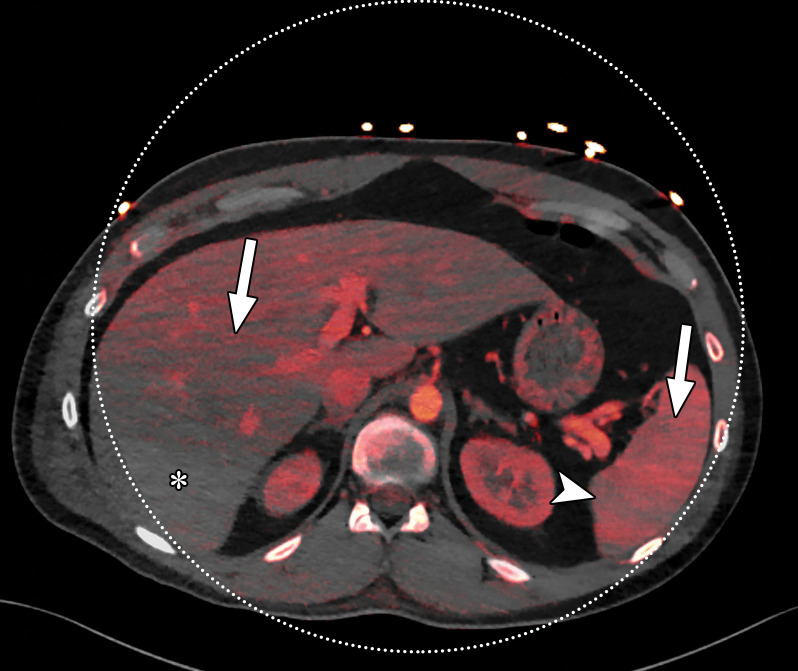
Beam hardening due to arm positioning. (a) Topographic image obtained for abdominopelvic CT with a dual-source scanner, which processes DECT images in the image domain, shows that the patient was scanned in the "right arm down" position. (b) Axial single-energy–equivalent image shows dark streaks (arrows) emanating from the humerus that extend across the liver and spleen. Dotted circle = spectral FOV. (c) On an axial color overlay MD-iodine image, the streaks (arrows) also affect depiction of iodine distribution. Even though the posterior hepatic segment (*) and spleen (arrowhead) lie within the spectral FOV (dotted circle), they artifactually show lack of iodine uptake, which can mimic a parenchymal infarct.

Beam hardening due to arm positioning. (a) Topographic image obtained for abdominopelvic CT with a dual-source scanner, which processes DECT images in the image domain, shows that the patient was scanned in the "right arm down" position. (b) Axial single-energy–equivalent image shows dark streaks (arrows) emanating from the humerus that extend across the liver and spleen. Dotted circle = spectral FOV. (c) On an axial color overlay MD-iodine image, the streaks (arrows) also affect depiction of iodine distribution. Even though the posterior hepatic segment (*) and spleen (arrowhead) lie within the spectral FOV (dotted circle), they artifactually show lack of iodine uptake, which can mimic a parenchymal infarct.