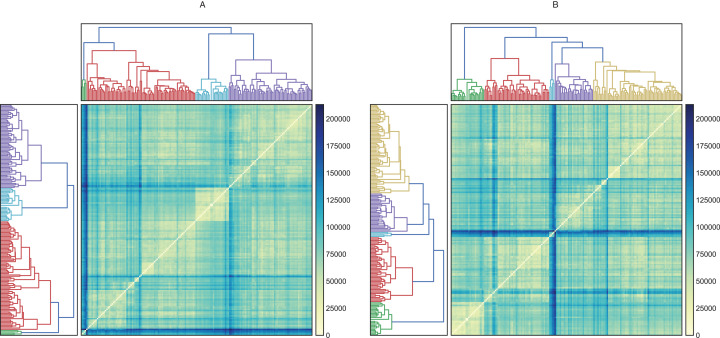
Figure 4. Hierarchical and heatmap analysis utilizing (A) raw data and (B) data processed by PCA.
These heatmaps show how similar (near zero) or different (about 200,000) the individuals in the clusters are. A cluster is interesting when its members are very similar and are very different from individuals in other groups.

