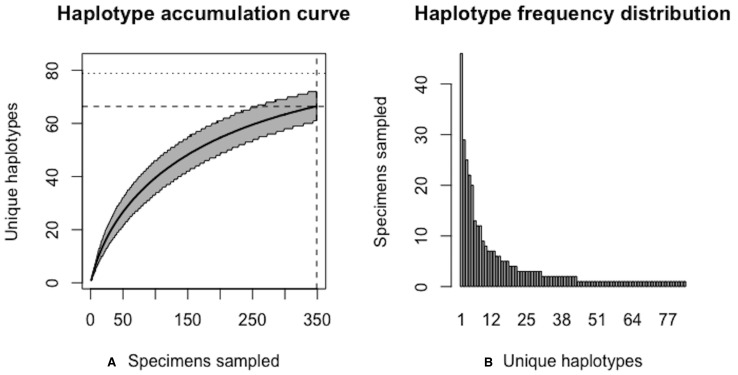
Figure 12. Initial graphical output of HAC.sim() for a real species (Deer tick, I. scapularis) having eight dominant haplotypes.
In this example, initially, only R = 78.7% of the H* = 83 estimated haplotypes for this species have been recovered based on a sample size of N = 349 specimens. The haplotype frequency barplot is identical to that of Fig. 11.

