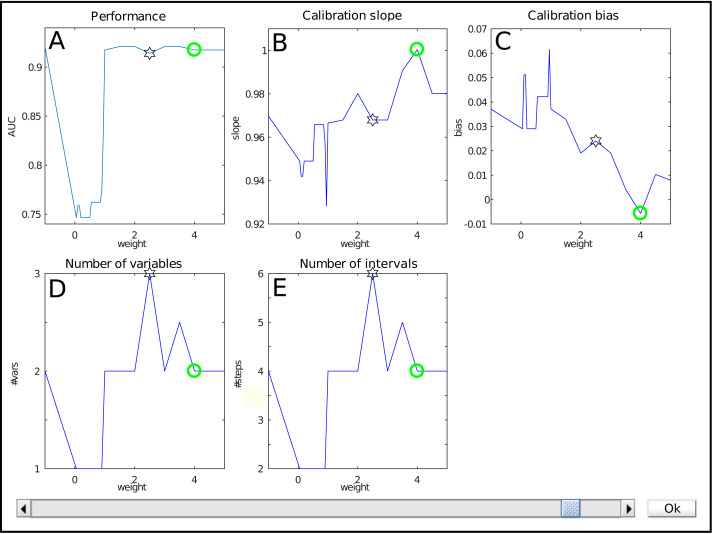
Figure 2. The weight selection interface during iterative reweighting shows crossvalidation results for various values of the reweighting parameter (‘weight’) a.
The model performance is expressed by the Area under the ROC curve (A), calibration is assessed using the slope and bias of the calibration curve (resp B, C). The complexity of the model is indicated by the number of variables (D) and intervals (E). Selection of a weight a occurs via the slider at the bottom.

