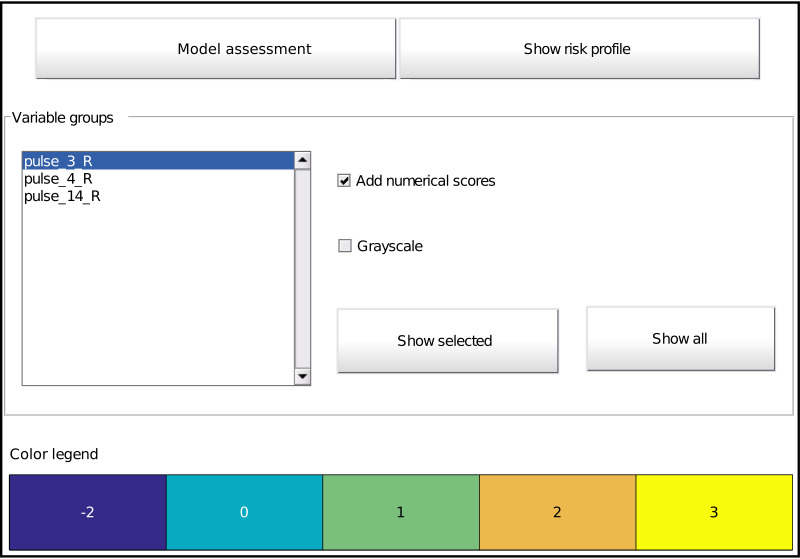
Figure 5. Main graphical interface to access the model. Two buttons at the top display the assessment interface (Fig. 6) or the risk profile (Fig. 4), respectively.
The middle part shows all effects in the model as a list and buttons to display the selected effect or all effects at once (Fig. 3). Optionally, one can overlay the interval points or use a grayscale representation. The bottom part provides the colour legend common to all displayed effects.

