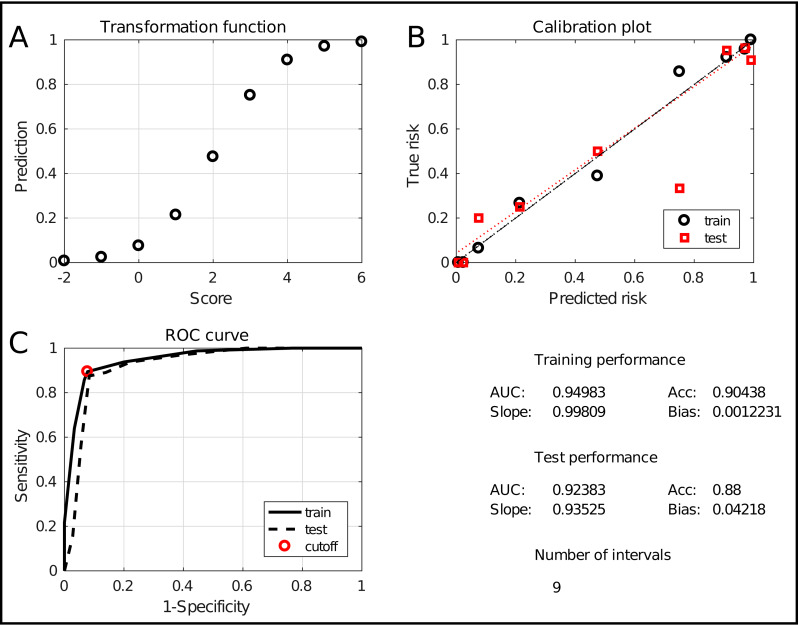
Figure 6. The ICS assessment interface.
It shows the transformation between scores and predictions (A), the calibration curve (B) and the ROC curve (C). It also evaluates the performance and complexity numerically by means of the AUC, the accuracy, the slope and bias and the total number of intervals.

