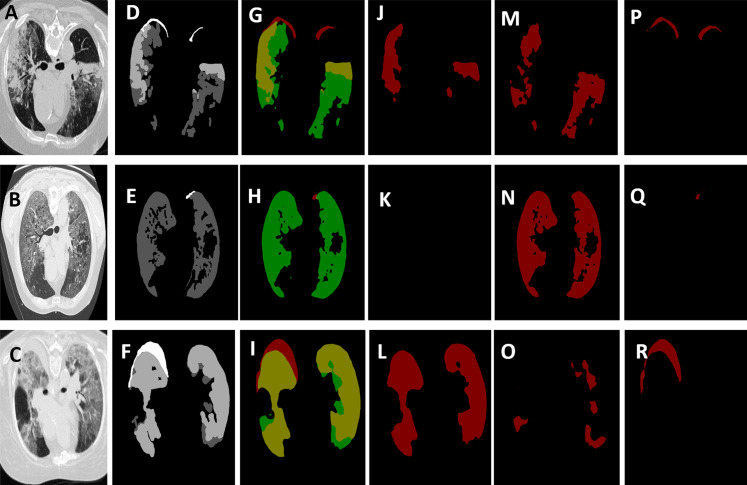
Figure 10. The output segmentation masks of the adopted deep models.
The images in column 1 from (A) to (C) show the chest CT images of three scans. Column 2 from (D) to (F) shows the ground-truth masks for these three scans, where the white represents the consolidation, dark gray represents pleural effusion and light gray corresponds to ground-glass opacities. Column 3 from (G) to (I) depicts the segmentation results generated by our model for all classes where the red represents the consolidation, the green represents the pleural effusion, and the yellow represents the ground-glass opacities. The images in columns 3, 4, and 6 from (J) to (R) represent the output from the specialized stream that are trained to segment ground-glass opacities, pleural effusion, and the consolidation, respectively.

