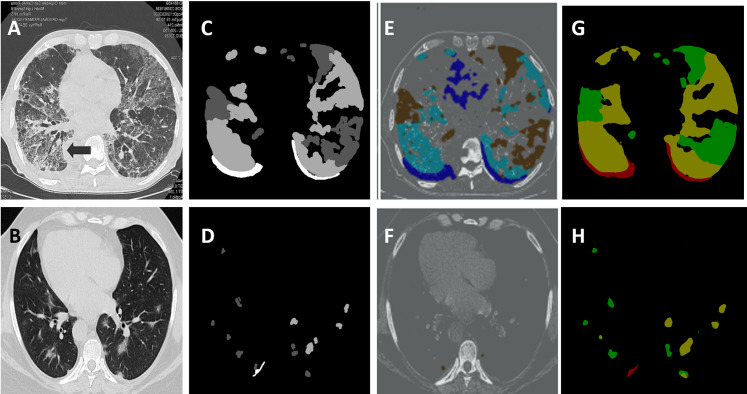
Figure 11. Segmentation output visualization results.
(A) and (B) chest CT images of two scans. (C) and (D) ground-truth masks for these two scans, where the white represents the consolidation, dark gray represents pleural effusion and light gray corresponds to ground-glass opacities. (E) and (F) the outputs of the U-Net. (G) and (H) the segmentation results generated by our model.

