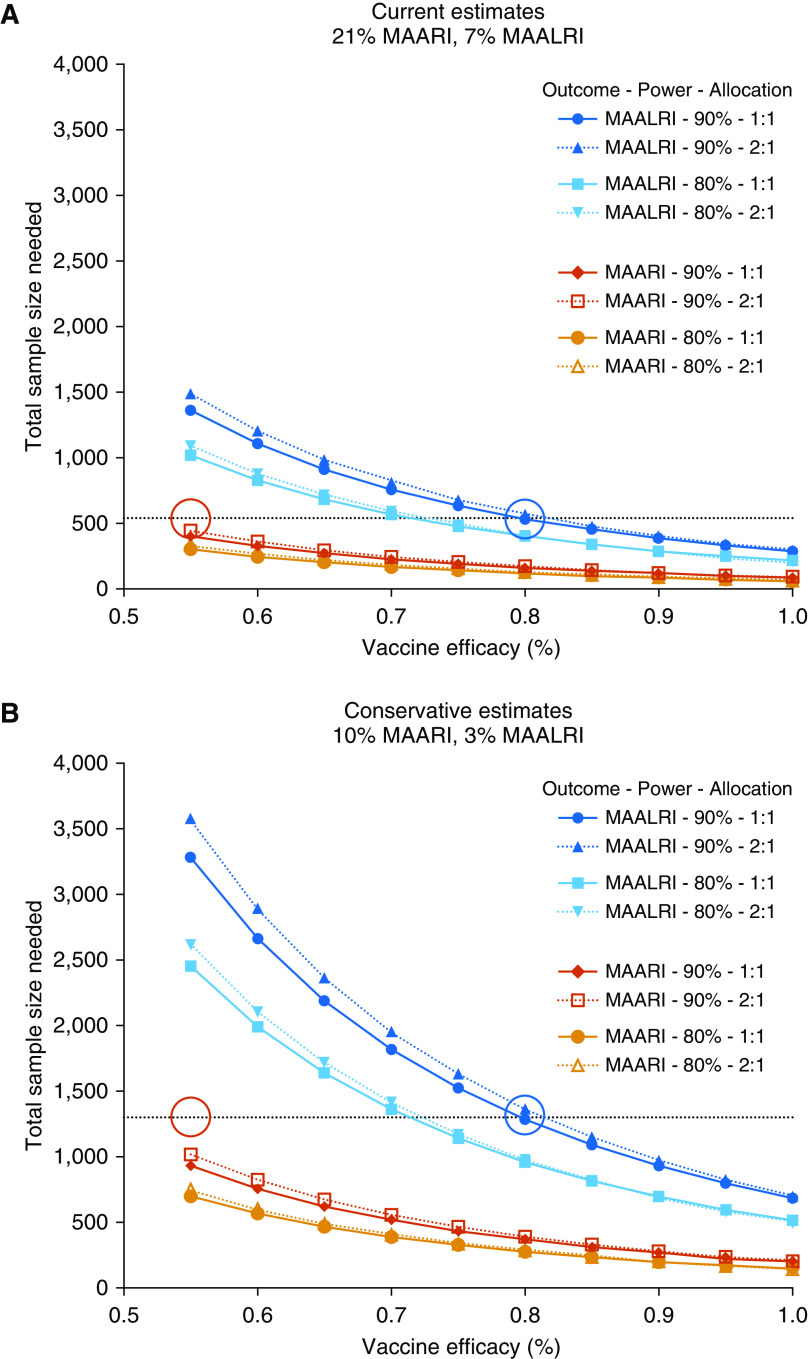
Figure 6.
Power curves showing estimates of sample sizes needed to detect varying levels of vaccine efficacy against respiratory syncytial virus (RSV)-associated medically attended acute respiratory illness (MAARI) in RSV-seronegative children (red, 90% power; orange, 80% power) and against RSV-associated medically attended acute lower respiratory illness (MAALRI) (dark blue, 90% power; light blue, 80% power). In each case, the solid lines assume a 1:1 vaccine-to-placebo allocation, whereas dotted lines indicate a 2:1 allocation (note that these lines are very similar). The upper panel uses estimates of RSV-MAARI and -MAALRI attack rates derived from our study data (“current estimate”; 21% and 7%, respectively), whereas the lower panel assumes attack rates that are half as large (“conservative estimate”; 10% and 3%, respectively). Dotted lines indicate a sample size of (A) 540 and (B) 1,300; red circles, 55% efficacy against RSV-MAARI; blue circles, 80% efficacy against RSV-MAALRI.

