
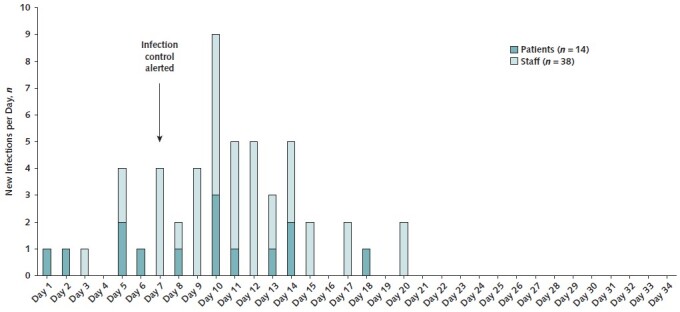
Figure 1. Epidemic curve showing the count of new patient and staff cases per day (by date of symptom onset or test date, whichever was earlier).
Official websites use .gov
A
.gov website belongs to an official
government organization in the United States.
Secure .gov websites use HTTPS
A lock (
) or https:// means you've safely
connected to the .gov website. Share sensitive
information only on official, secure websites.